Infographic: Europeans and Sunscreen
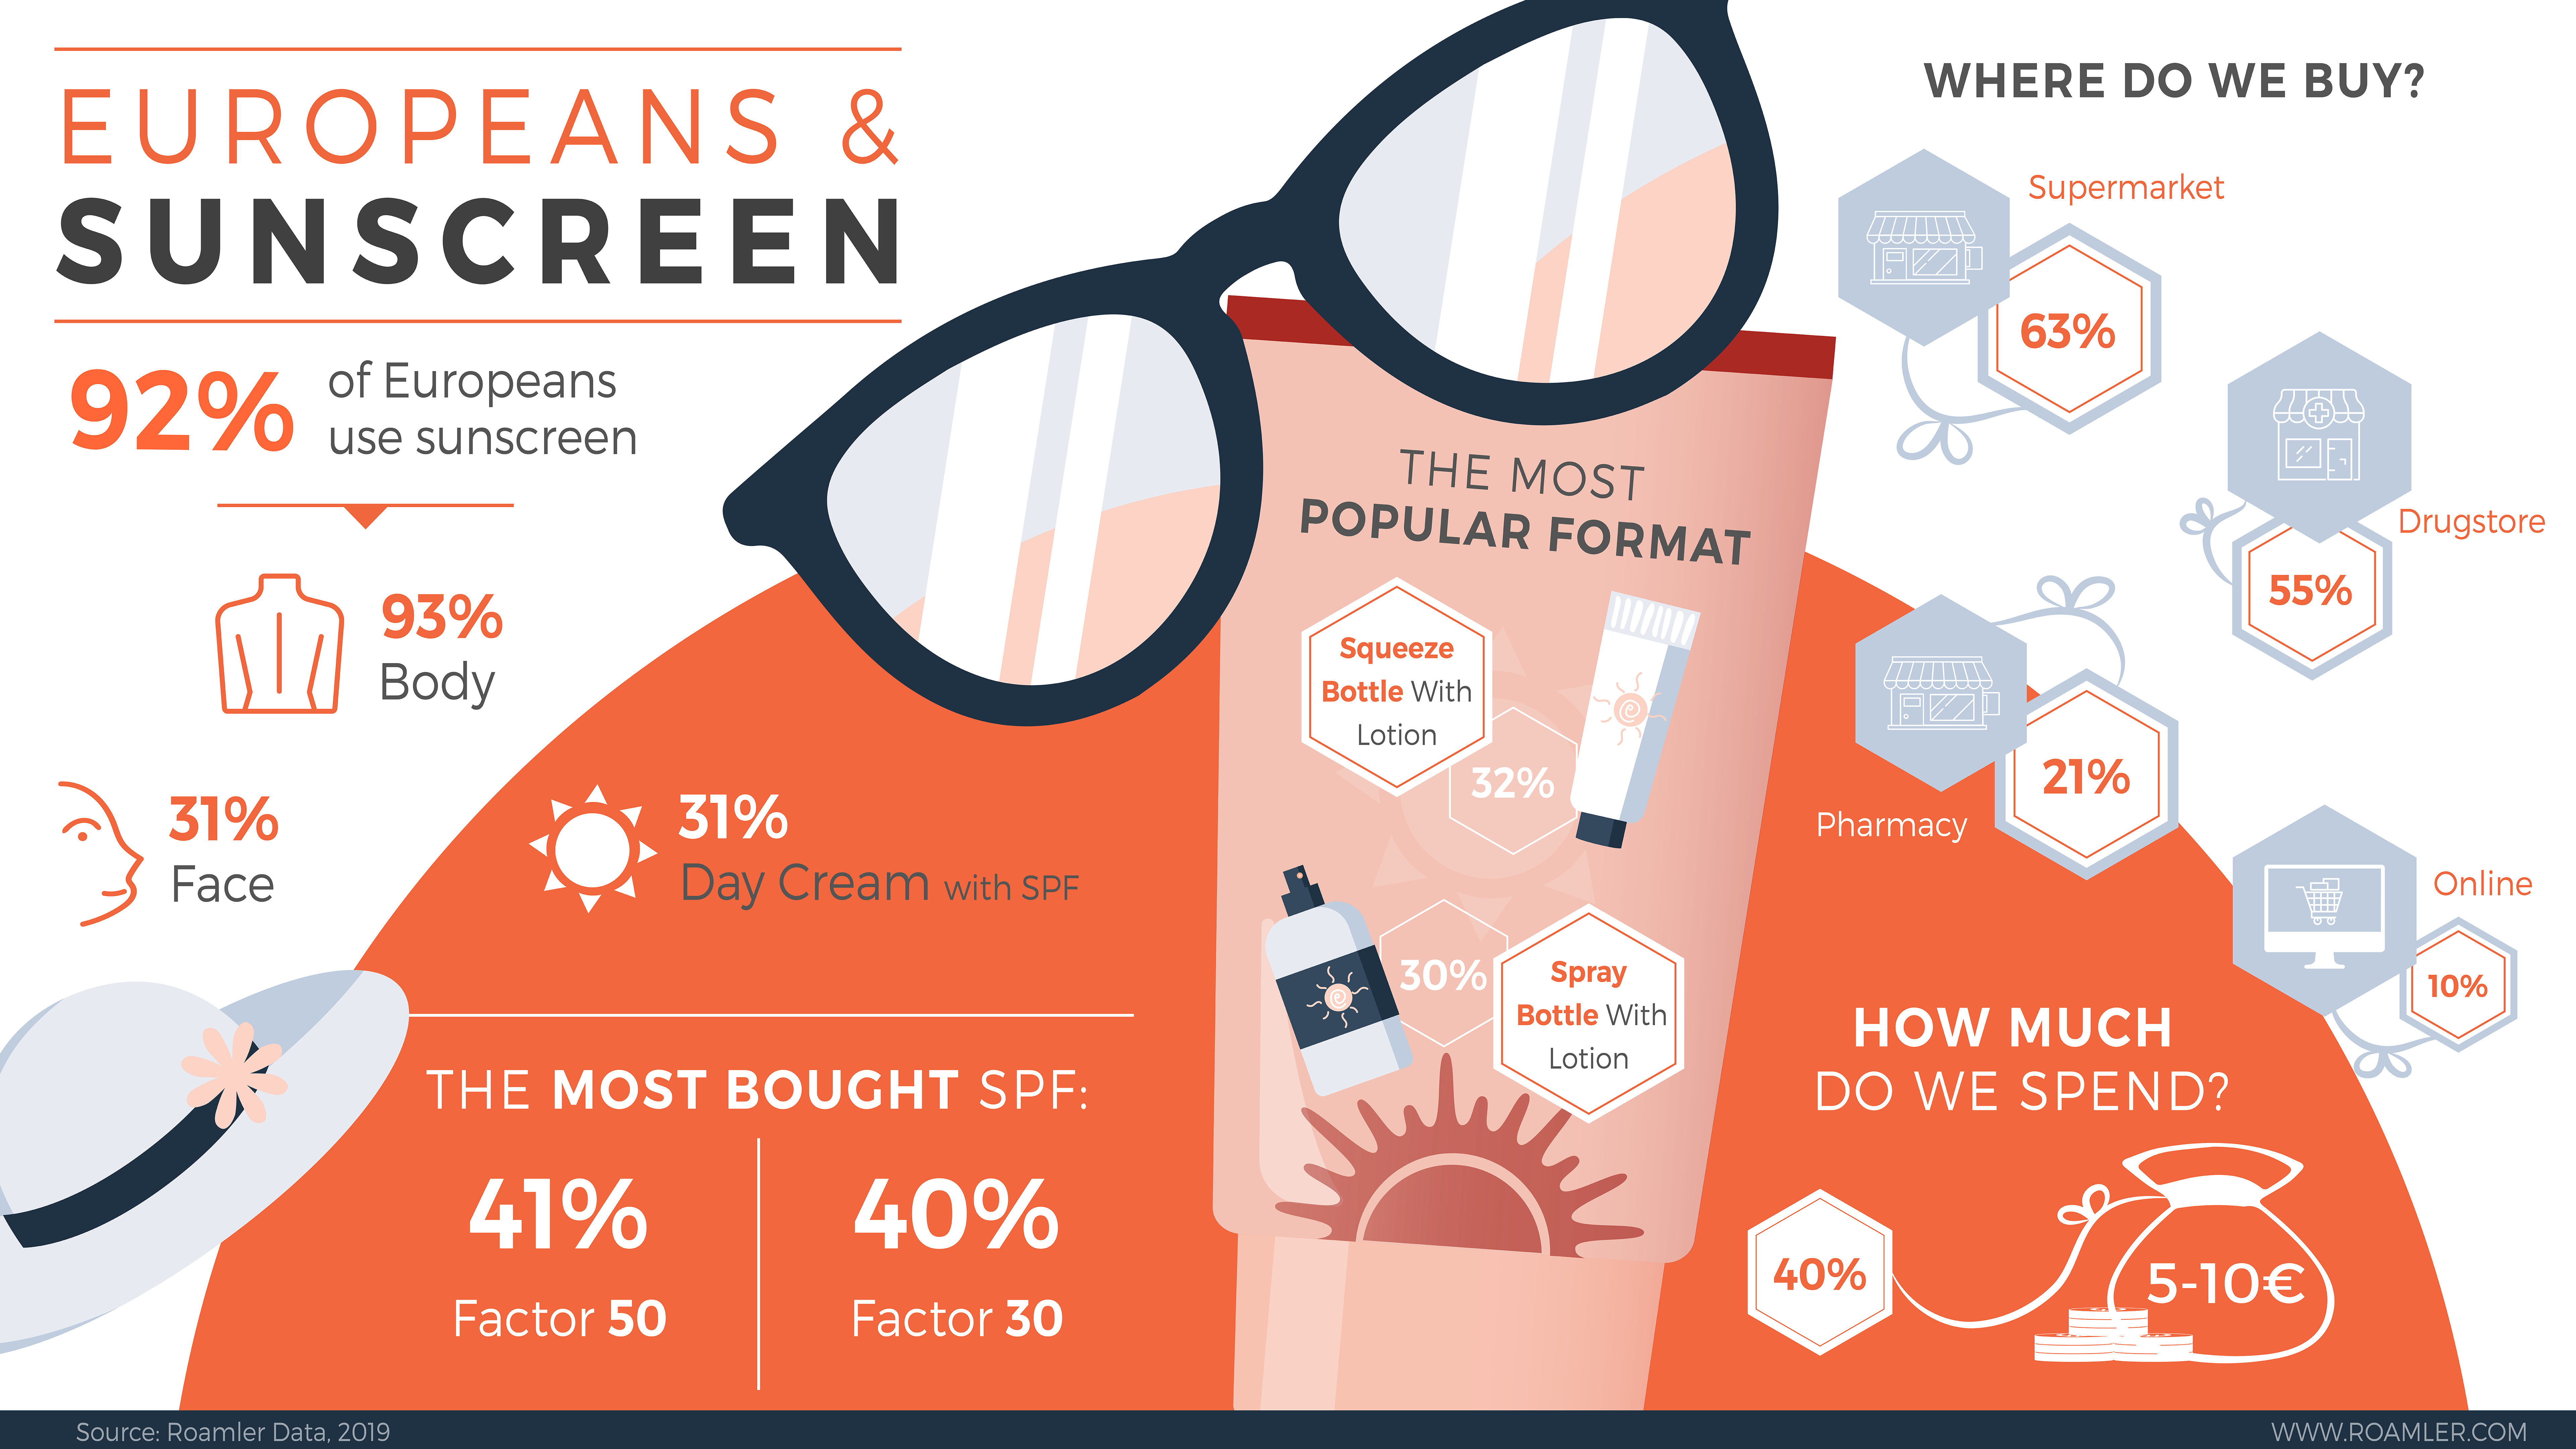
92% of Europeans use sunscreen products. Curious to know what is the most popular SPF factor or package format? Consult our infographic
92% of Europeans use sunscreen products. Curious to know what is the most popular SPF factor or package format? Consult our infographic
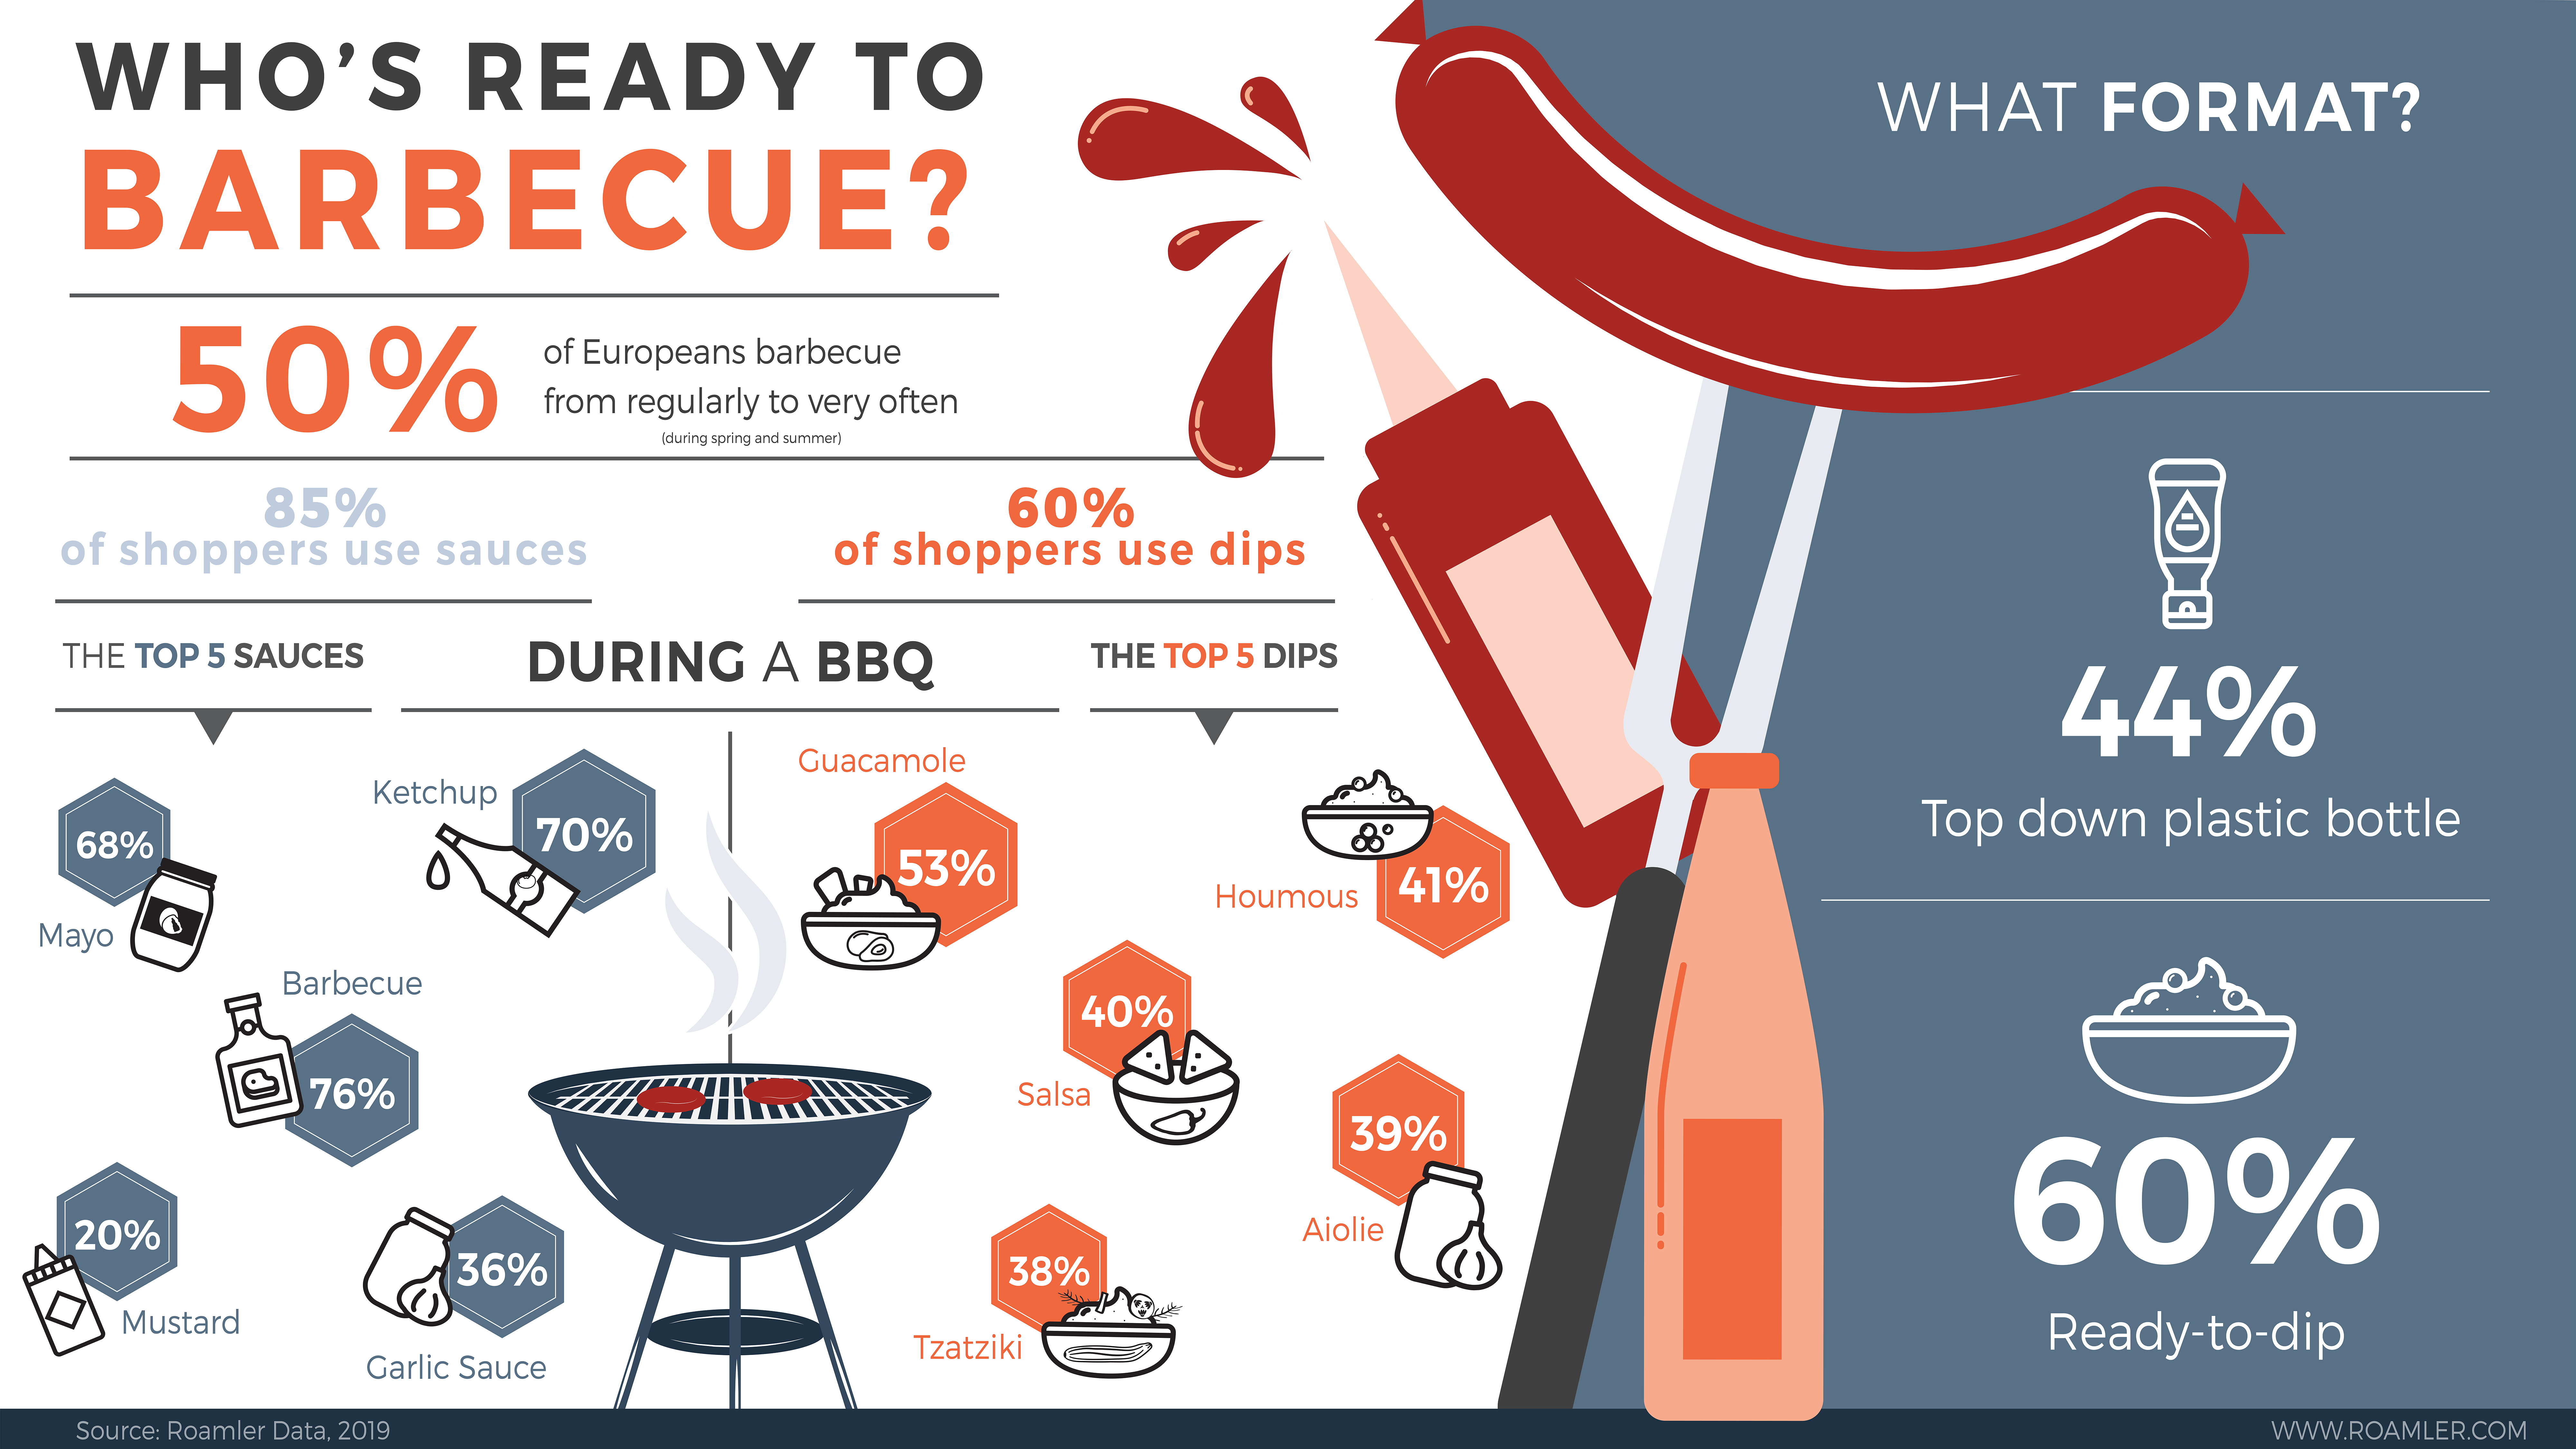
It’s summer and Europeans are ready to barbecue! Read (and see) more about the Europeans barbecue practices in our latest infographic, focused specifically on the consumption of sauces and dips.
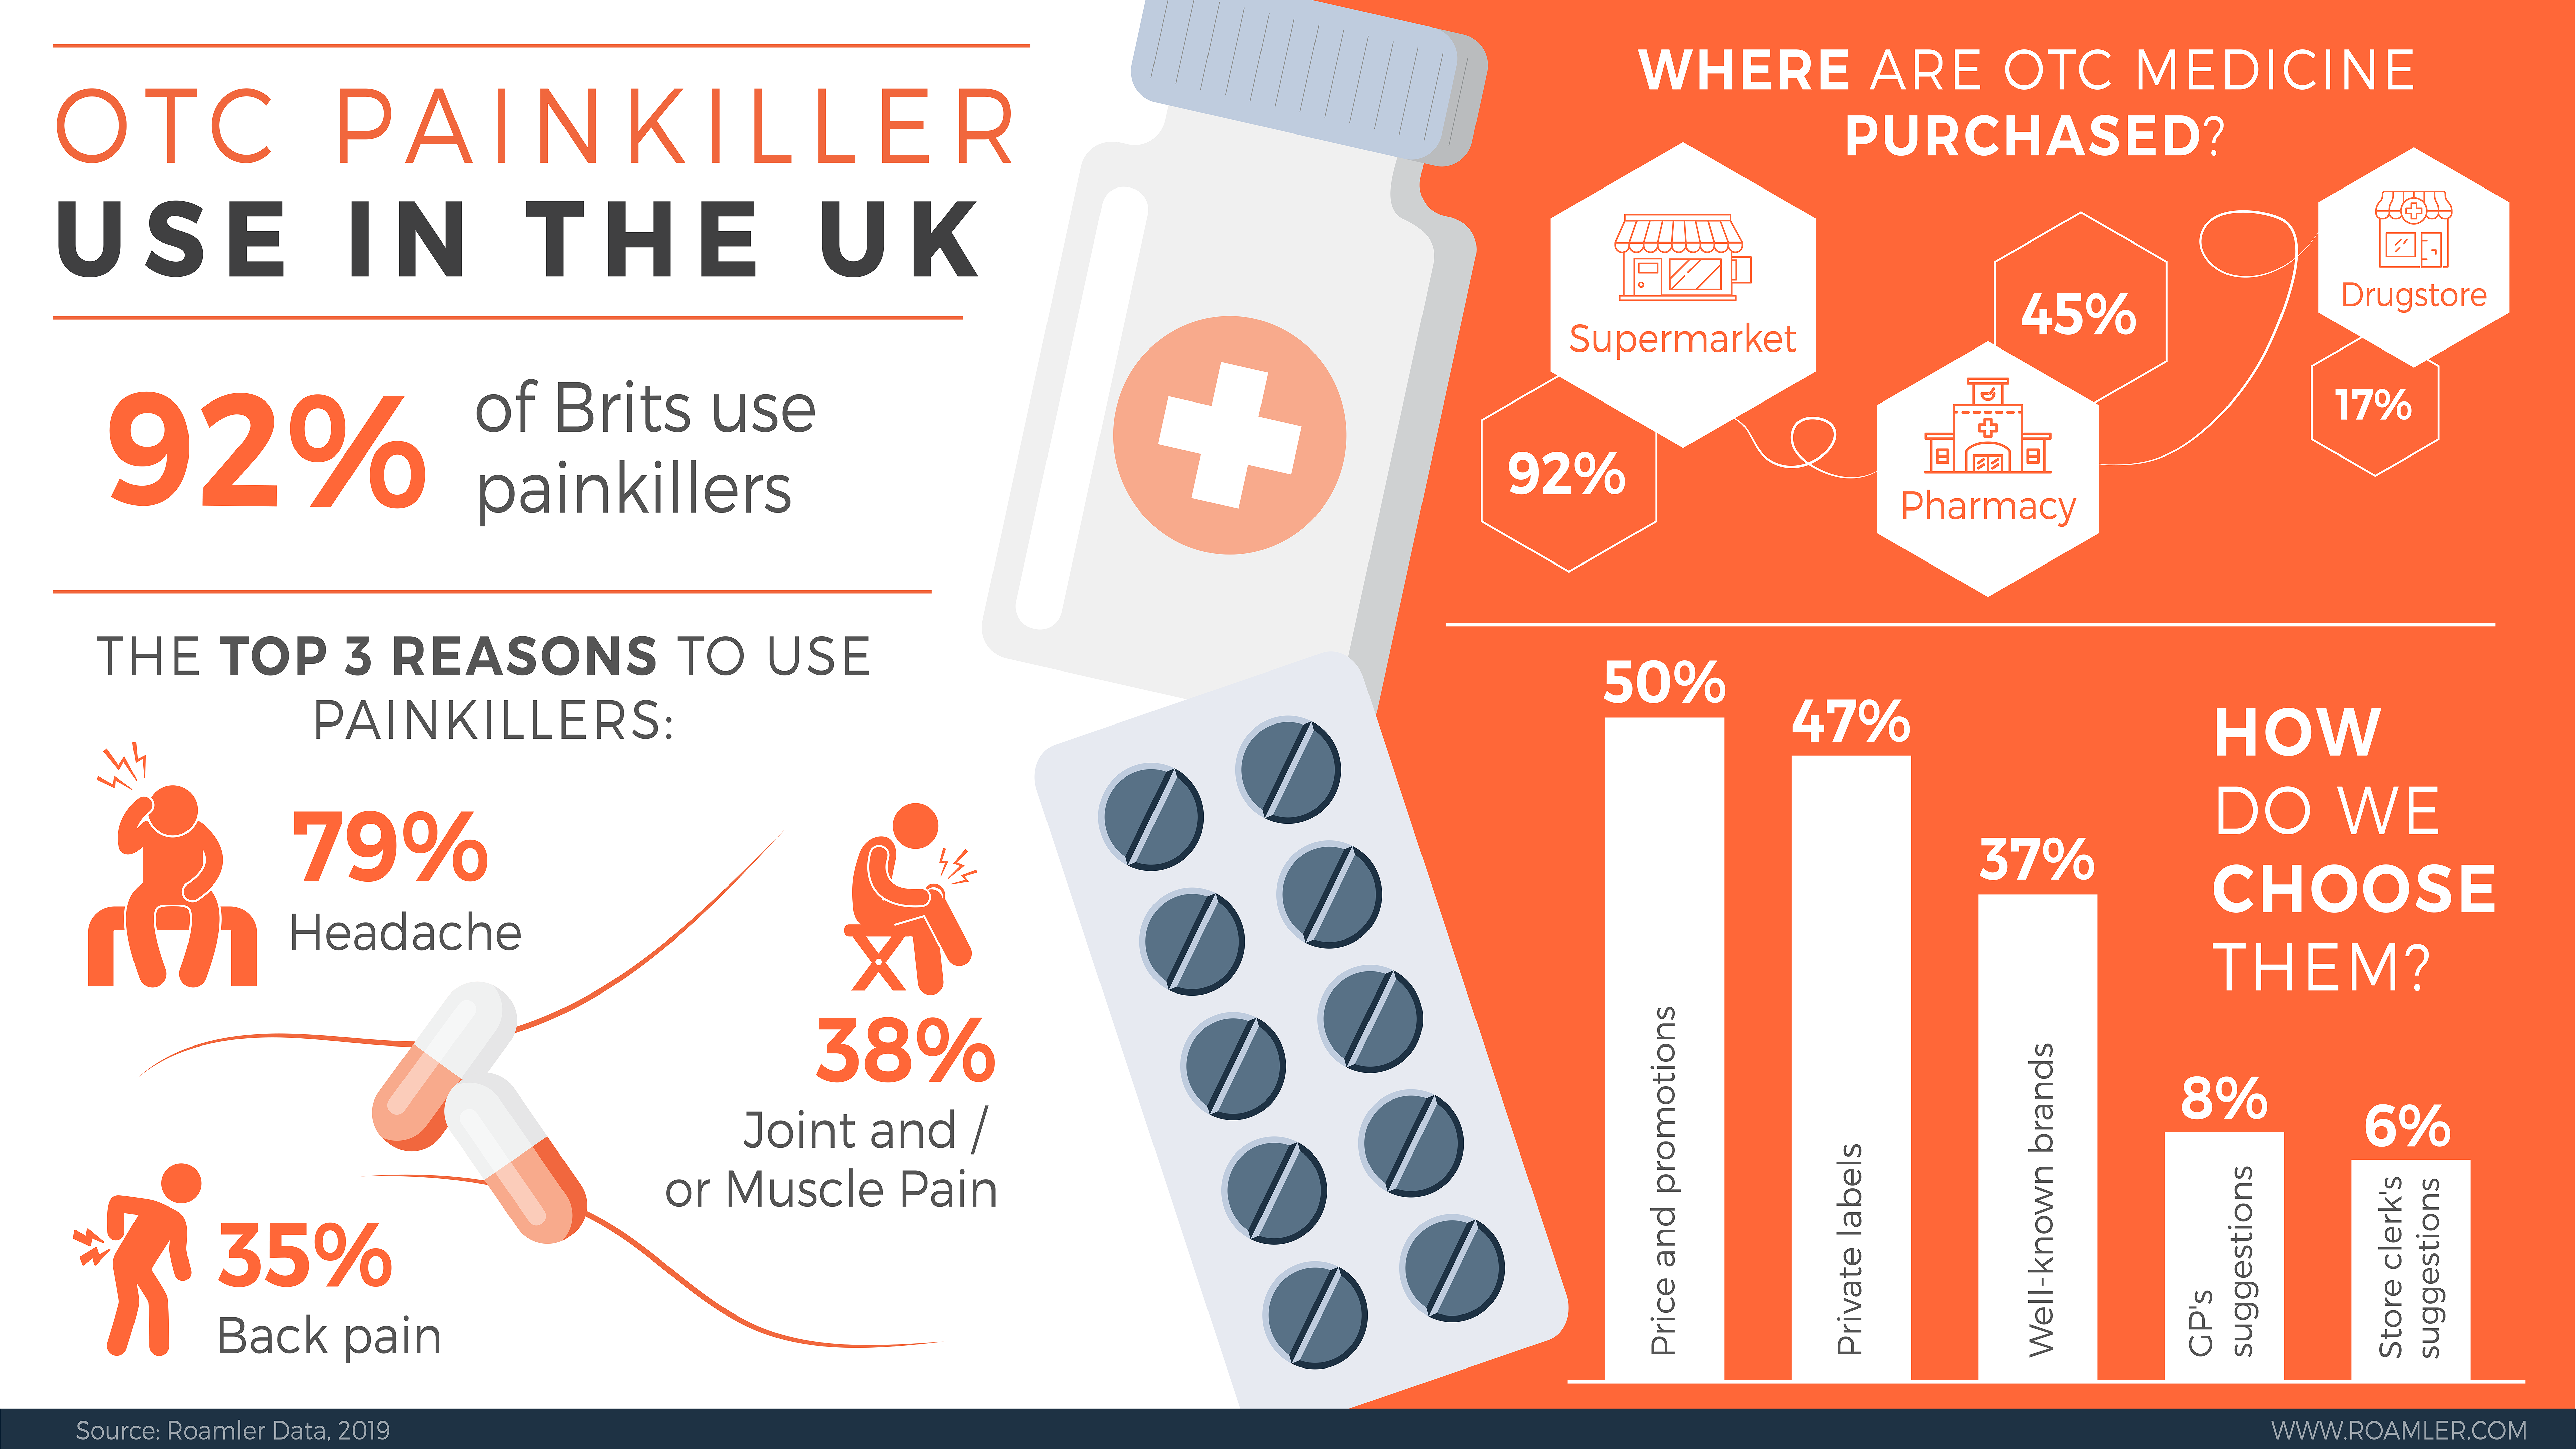
Did you know the main reason to use painkillers is headache? Explore our infographic to know more!
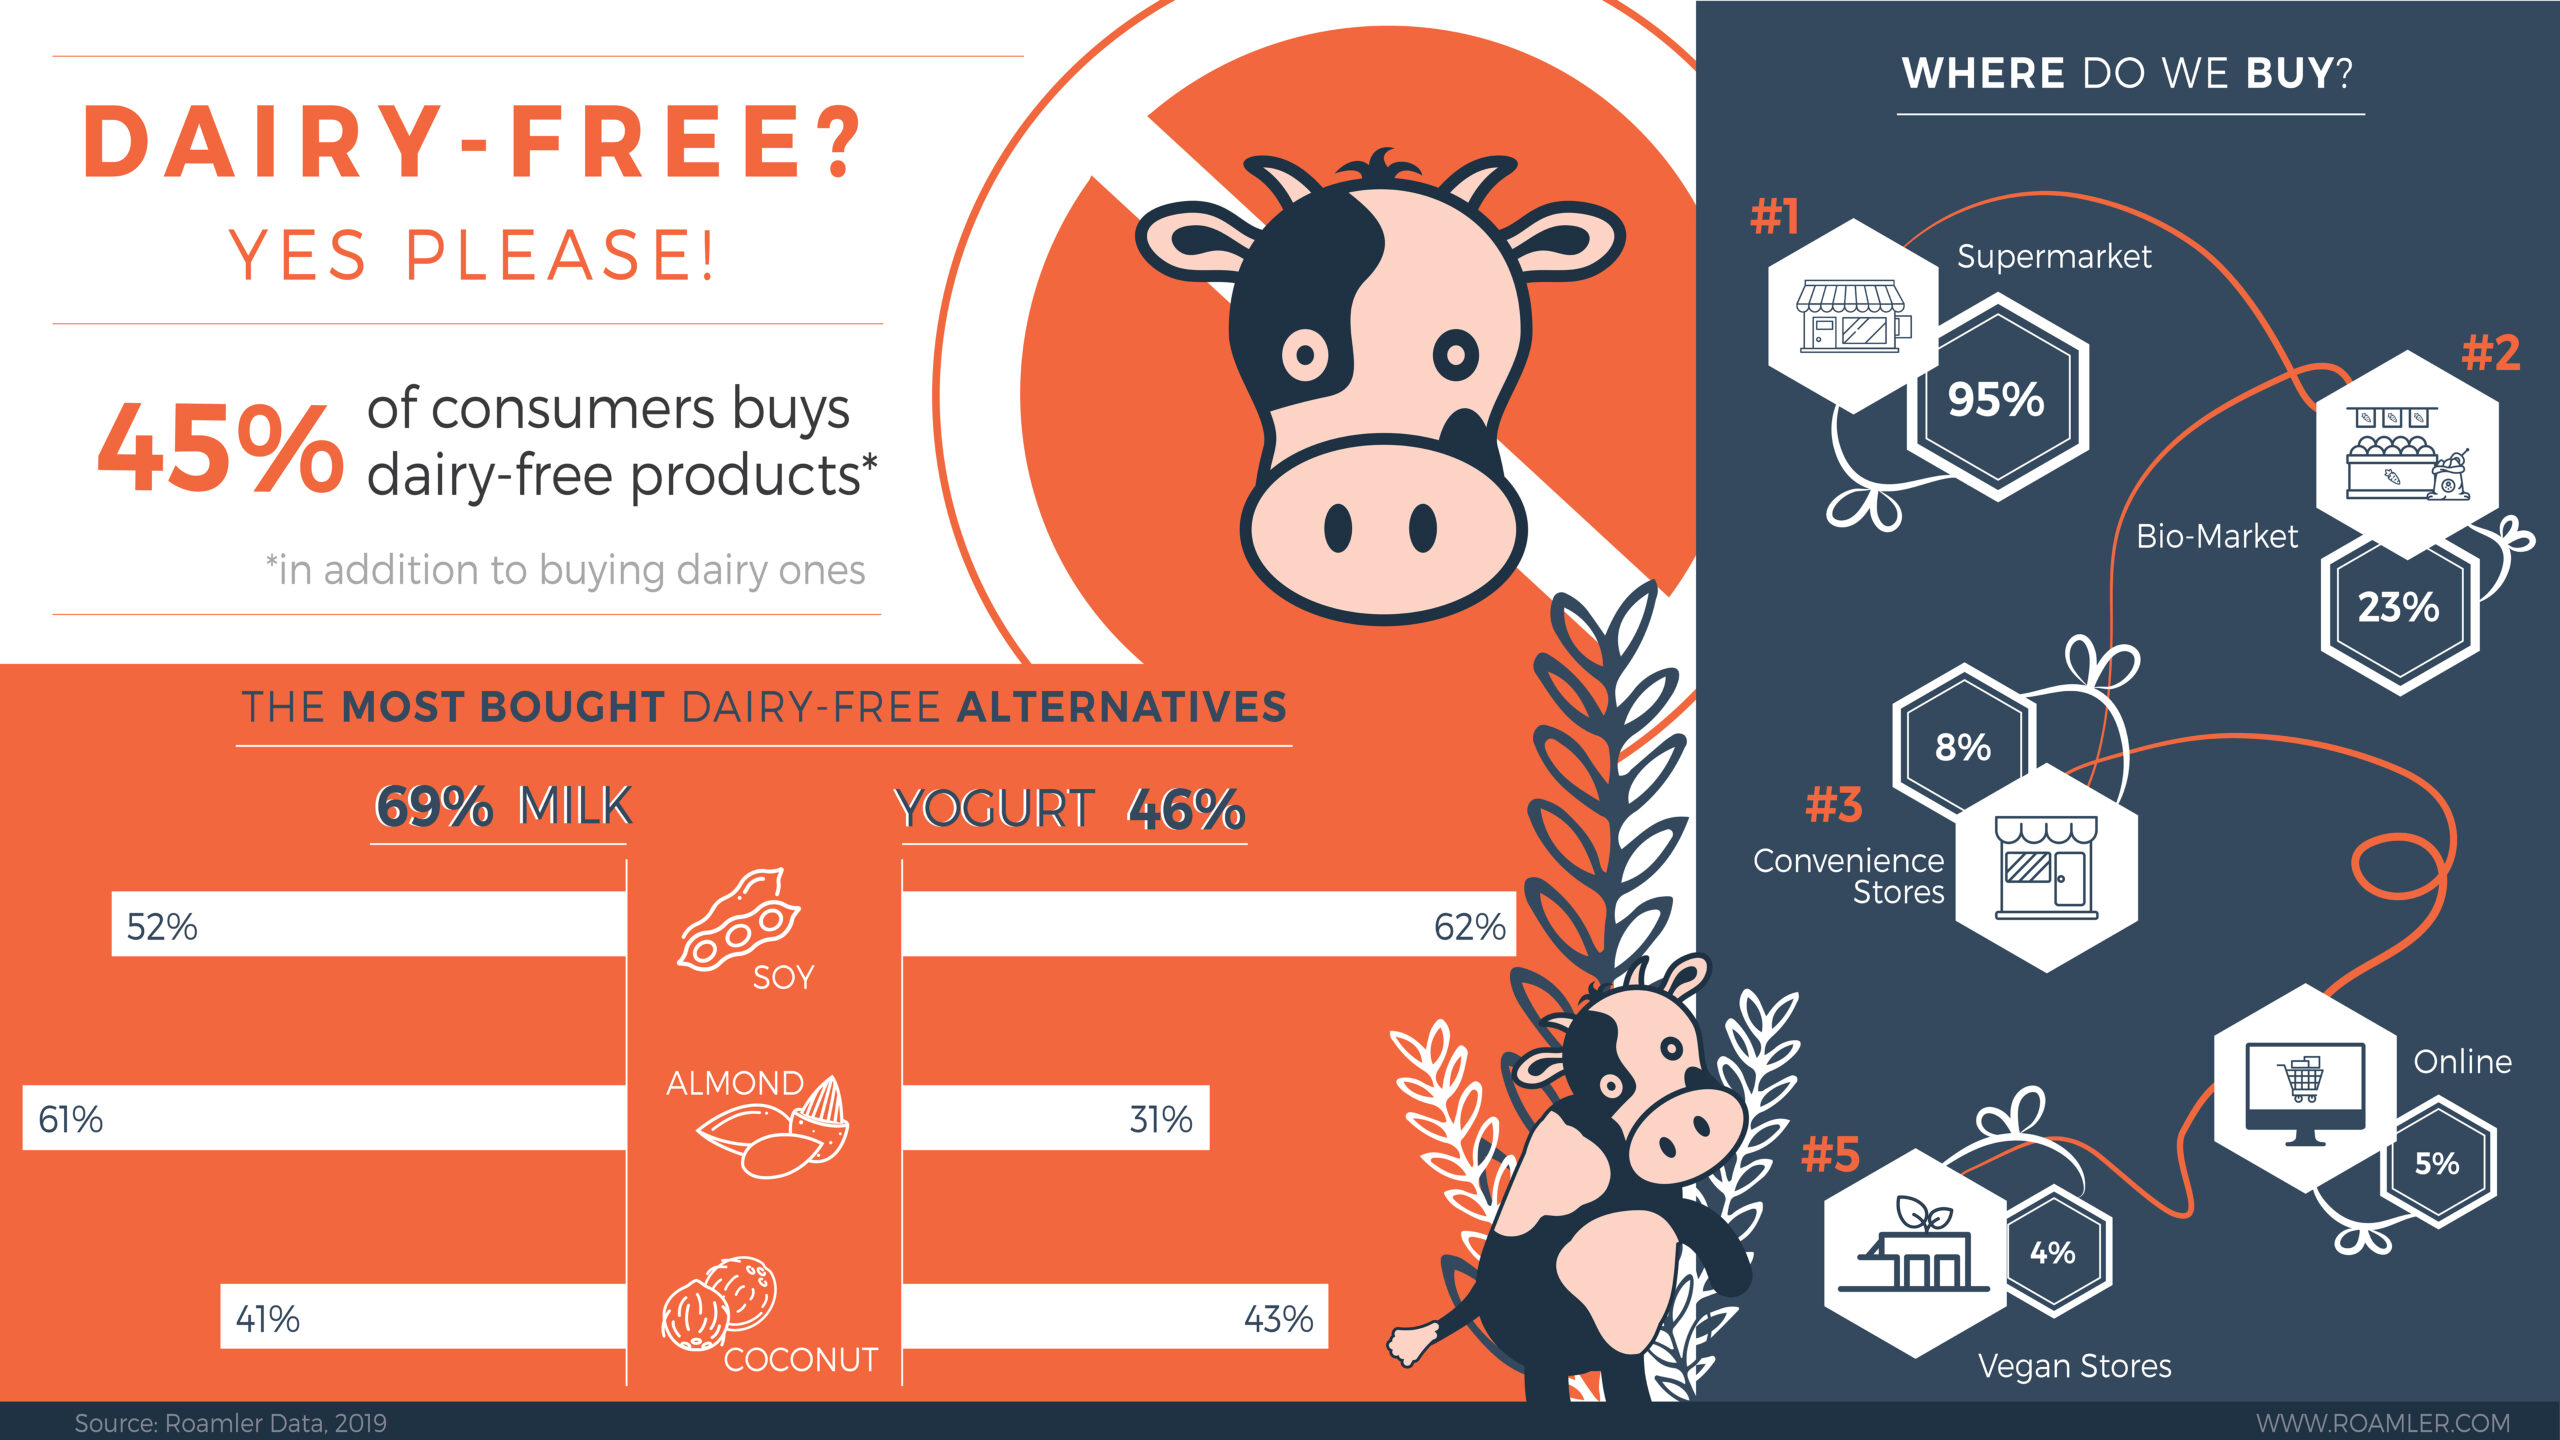
Dairy-free products are getting more popular in Europe, especially when it comes to plant-based milk and yogurt. Curious to know more? Consult our infographic!
C-store retailers are winning more and more consumers. What are the most bought products in convenience stores and why? Explore our infographic to know more!
Europeans are great tea lovers. Curious about their purchasing and consumption habits? Explore our infographic!
With lots of family gatherings and parties, the Christmas holidays surely put women under more pressure to look good. What are the most sought after products during this time of the year? Our infographic tells you all about it.
According to our latest research chocolate milk is the preferred hot beverage during the winter. Interested in knowing more about how Europeans consume this sweet treat? Explore our infographic!
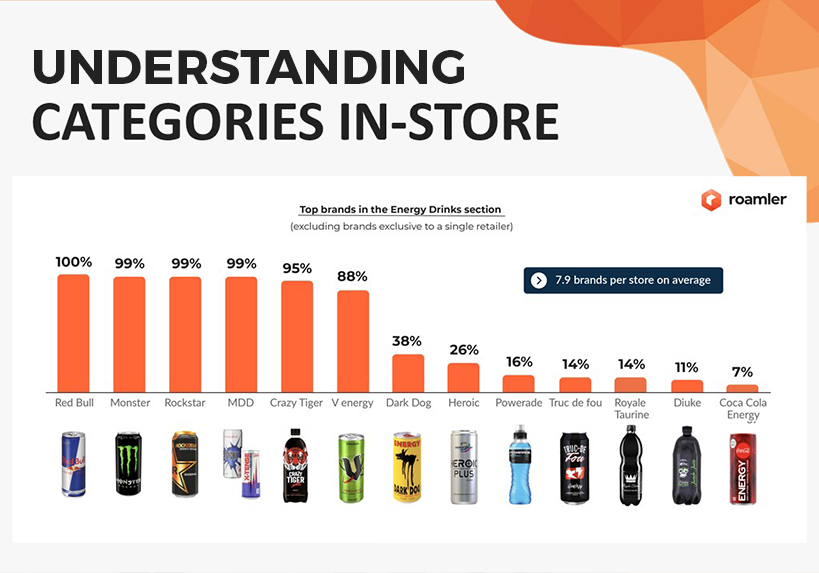
The reality of the shelf is sometimes far from the theory of planograms! Find out what key indicators you can measure, in order to better understand the implementation of your category in-store.
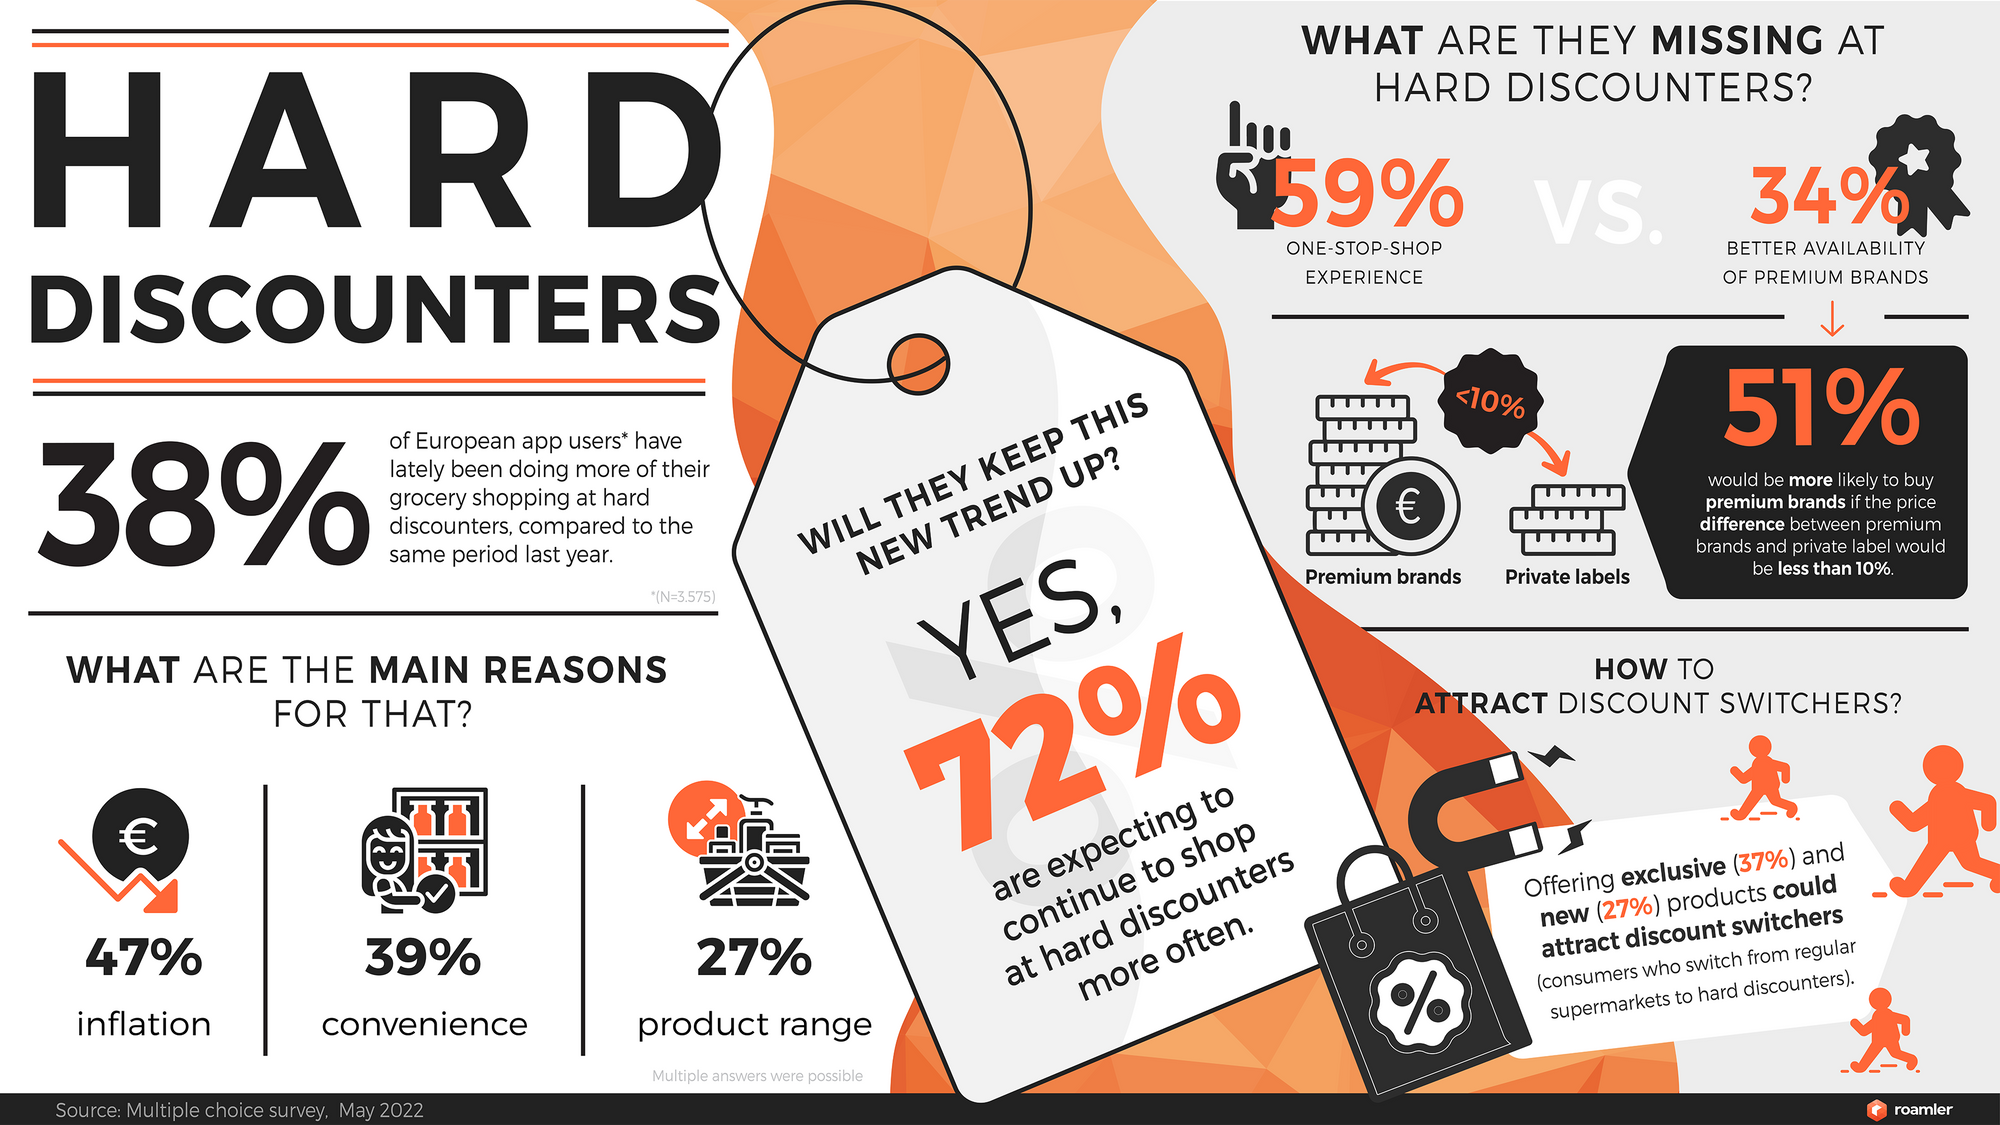
We have asked our European Roamler community of app-users about their hard discounter consumer behaviour, providing you with insights on their shopping motives and preferences.