The pressure on FMCG companies to achieve better results is as great as ever. On one hand, volumes and turnover must continue to grow, while on the other, there is limited room for price increases due to sharp rises in recent years. Additionally, costs must be closely monitored as margins remain under pressure. The message for field sales is clear: we want to sell more, visit more locations, collect more data—all at the same or lower costs. Achieving this requires one thing: efficiency within the sales organization.
The traditional approach of many FMCG field sales organizations no longer suffices. Fixed territories, visit schedules, and routes for field employees create a rigid contact strategy that leaves little room for flexibility. Thanks to the availability of data, much smarter choices can now be made. Sales data—provided directly from the retailer at store level—is an invaluable source for this. This data, if properly processed, helps answer the question: where can we currently add the most value with a visit?
The power of EPOS data
As a manufacturer, you can access sales data through contracts with retailers. Depending on the agreements, this data is available at store level for your products or for the entire category. Store sales data is also known as EPOS or Sell-out data.
With the focus on data in general, attention to EPOS data has also grown. In addition to measuring your sales results, there should be more to it, right? And the answer is, of course, yes—a lot!
Tracking patterns, identifying anomalies
Inspired by data models from the financial industry (banking/fraud detection), we began applying these models to EPOS data four years ago, together with a leading FMCG manufacturer. Although the complexity behind the scenes is significant, the concept itself is easy to explain.
Stores with the same or very similar sales patterns are merged (clustered) and tracked over time. If a deviation occurs in one of these stores from the cluster, it provides a reason to visit that store and determine the cause of the deviation. The developed data model is enriched with this knowledge. By doing this over a longer period, we validate the data model, and it becomes so smart that it can eventually even offer predictive value.
In this context, deviations are translated into a financial value. A well-known concept here is the Lost Sales Value (how much turnover are you missing out on?). In other words, this way of working with data not only tells you where to make an intervention; it also specifies how much you can earn from it. Depending on what the data model detects, a decision is made on the type of intervention needed and who should be sent for it. This could be someone from your field sales team or, if there is a more structural issue, an intervention at the head office (via KAM).
EPOS data – an example
A valuable application of data models based on EPOS data is to improve shelf availability (OSA). Let’s say you’re a supplier to a retailer with 600 store locations, and you have access to this retailer’s sales data at the store level.
With proper modeling of sales data, stores with similar sales patterns are tracked over time. Occasionally, for a number of days within one of these stores, the sales of your products may decrease. If this applies to all stores in the cluster, it is likely that there is a normal trend (it fits the pattern). However, if the store in question deviates significantly from the rest, this warrants attention. Because the model is fed with potential causes and also knows the normal sales patterns, a very concrete outcome can be: ‘At this store location, SKUs XYZ have not been sold for two days, even though they are in distribution. The resulting lost daily turnover amounts to € XXX.
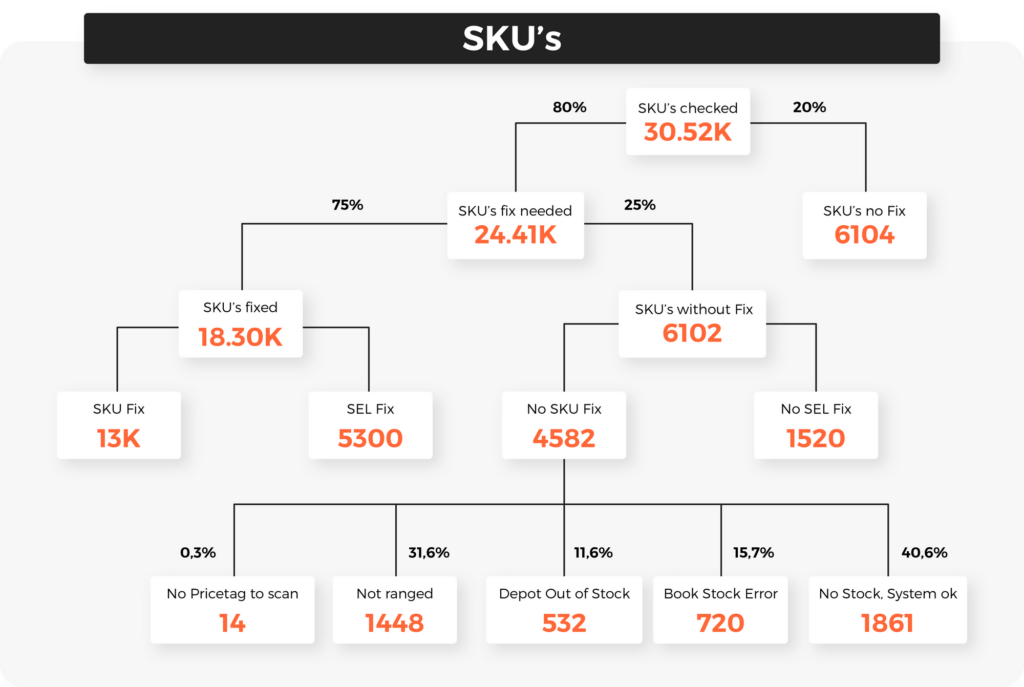
Your field sales organization immediately follows up on this signal and discovers at the store location that the shelf labels for the SKUs in question are no longer present. As a result, no order is placed for these products, and the shelf remains empty. Immediately after this intervention, the order can still be placed, and sales will start again. Your field sales organization can therefore make highly targeted interventions with an almost guaranteed return. In the programs we run now, that probability is 80%!
Similar causes
We have learned a lot in recent years about what sales data can bring to your organization. Looking at the example mentioned above, where the goal is to increase shelf availability, we see that the causes for out-of-stocks are often similar. What frequently occurs is exactly as described in the example: a product goes out of stock, and the store decides to ‘temporarily’ place something else in that spot to make use of the space. The old shelf tag is removed without the order being placed first. Another example is so-called ‘phantom stock.’ Theft-prone categories are often affected by this issue. In the event of theft, the retailer’s systems may indicate that there is still enough stock when, in fact, there is not, because products have been stolen. Shrinkage that is not properly processed in the systems also leads to this situation.

Always different stores
If only it were the same stores that always needed attention. That would make it easy to set up your field organization. Unfortunately, it’s the other way around. We can clearly see that the need for attention varies greatly. And that presents a significant challenge for field teams; after all, they have to deviate from planned routes to make the necessary interventions. This requires a high degree of flexibility in your field organization. The use of a crowdsourcing partner is a good option, contact us for more information!
Want to learn more about how EPOS data can improve field sales?
Contact us to explore the possibilities!
