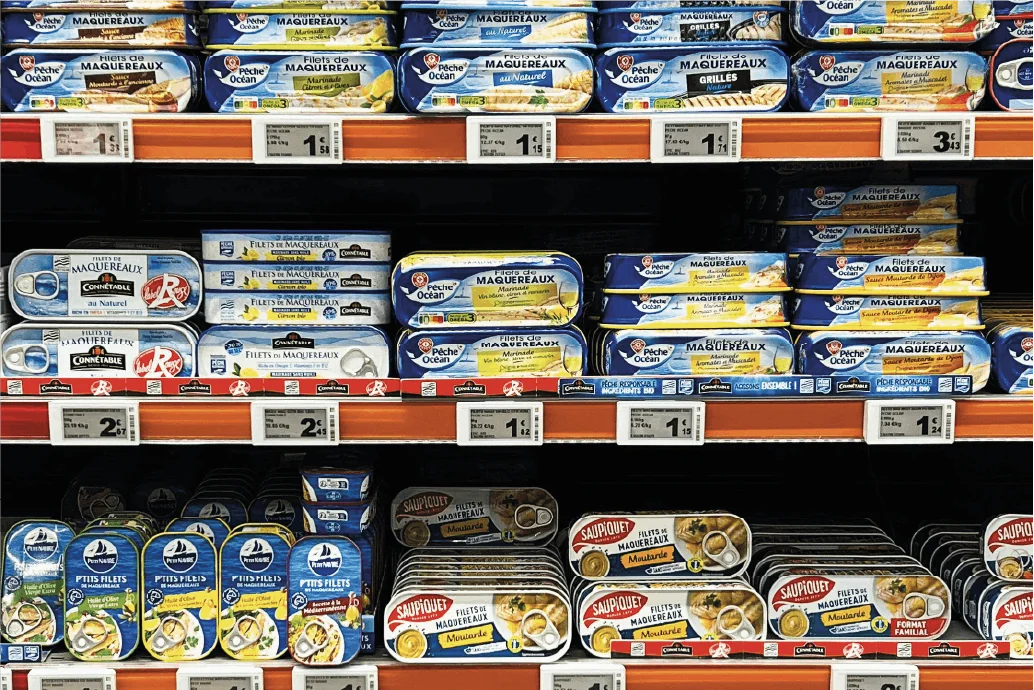
Definition: What Is Share of Shelf?
Share of Shelf is the proportion of physical display space — linear metres, facings, or shelf area — that a brand or SKU occupies within a defined product category, at a given point of sale.
Formula: Share of Shelf (%) = brand's linear space ÷ total category linear space × 100.
Example: a yoghurt category occupies 10 linear metres in a supermarket. A brand's products take up 2.5 of those metres. Its Share of Shelf in that category is 25%.
Share of Shelf is tracked at several levels:
- SKU level — a single product reference
- Brand level — every SKU under one brand
- Segment level — e.g. Greek yoghurt versus flavoured yoghurt within dairy
- Supplier level — every reference a manufacturer owns across all its brands
Why Share of Shelf Matters
📈 It correlates directly with sales volume. More facings mean more visibility, which drives more spontaneous purchase. In impulse and convenience categories — where most decisions are made in-store — this relationship is particularly strong.
🤝 It reflects negotiating power. The shelf space a brand occupies is largely the result of commercial negotiations. A growing share of shelf signals a strengthening retailer relationship. A declining share — particularly one happening without the brand's knowledge — is an early warning of a deteriorating position or a competitor gaining ground.
💶 It measures the ROI of space investments. Many trade marketing budgets include end-caps, promotional islands, and secondary placements. Share of Shelf measurement verifies that these investments deliver the agreed visibility — and enables brands to calculate revenue return per square meter of space secured.
🔍 It's a competitive intelligence metric. A competitor gaining significant shelf space before a major promotional period is actionable intelligence. Tracking share of shelf across the full category — including competitor facings — reveals how the competitive landscape is evolving at the point of sale.
Share of Shelf vs. Market Share
These are related but distinct concepts — and comparing them is one of the most powerful tools in category management:
- Market Share measures the proportion of sales value or volume captured by a brand
- Share of Shelf measures the proportion of physical space allocated to a brand
A brand with disproportionately low Share of Shelf relative to its Market Share is under-represented at the point of sale — leaving revenue on the table and creating an opening for competitors. A brand with disproportionately high Share of Shelf may be over-investing in space for its return.
This comparison is increasingly used as a negotiating argument with retail buyers — particularly when framed as a category growth opportunity, not just a brand interest.
How Share of Shelf is Measured
Manual Field Measurement
Sales reps physically measure linear meters per brand during store visits. Accurate at individual store level, but slow, incomplete, and variable in consistency across reps and regions.
Photo-Based Measurement
Structured in-store pictures, combined with manual analysis or image recognition, calculates linear space per brand from shelf photos. When deployed via a platform like Roamler, this approach offers:
- 📸 Objectivity — photo evidence is verifiable and auditable
- 🗺️ Scale — hundreds of stores photographed simultaneously
- ⚡ Speed — results consolidated within days
- 📊 Trend tracking — the same shelf photographed over time provides wave-on-wave comparison
Planogram Compliance Checking
Rather than measuring raw space, some brands audit compliance with the agreed planogram — verifying whether the correct number of facings is maintained per SKU. This "compliance-first" approach is particularly relevant during promotional periods, when agreed space allocations are most likely to be disrupted.
How to Improve Share of Shelf
- Measure before you negotiate. Most brands enter space negotiations based on assumptions or historical data. Current, store-level data on actual vs. agreed share of shelf — and competitor share — transforms the quality of the argument.
- Prioritize by store volume. Gaining a facing in a high-volume hypermarket is worth far more than the same gain in a smaller proximity store. Improvement programs should be weighted by commercial importance.
- Audit compliance after negotiation. The most common failure mode in retail space management is the gap between centrally negotiated space and what is locally implemented. Post-negotiation compliance audits verify that agreed allocations are being respected.
- Track competitor movements. Category shelf share is zero-sum — if a competitor gains facings, someone loses them. Monitoring competitive shelf share gives early warning of threats that may not yet be visible in sell-out data.
- Build the category argument. Retailers respond to space reallocation requests framed as category growth arguments, not brand interest arguments. Brands that demonstrate higher sales per facing — or that a specific placement drives total category growth — have a structurally stronger negotiating position.
Some Frequently Asked Questions
How is Share of Shelf different from Share of Market?
Share of Market measures the proportion of sales volume or value a brand captures in a category. Share of Shelf measures the proportion of physical display space it occupies. The two don't always align, and that gap is usually where the opportunity lies — strong market share paired with weak shelf presence typically means a brand is under-represented at the point of sale and losing incremental sales to better-placed competitors.
What is a good Share of Shelf benchmark for FMCG brands?
There's no universal benchmark — what's healthy depends on the category, the retail network, and the brand's market position. As a general principle, Share of Shelf should be broadly proportional to Share of Market within a given retailer; significant under-representation signals an opportunity, and significant over-representation may mean inefficient space investment. The most useful benchmark is a brand's own Share of Shelf tracked over time, not an industry average.
How often should Share of Shelf be measured?
During a promotional period or right after a planogram reset, close to real time — that's exactly when allocations are most likely to be disrupted. Outside those windows, a monthly or quarterly cadence is usually enough to catch meaningful shifts in positioning and competitor activity.
Can Share of Shelf be measured without a field team?
Yes. Photo-based audits deployed via on-demand platforms like Roamler let brands collect shelf data across hundreds of stores simultaneously using independent, verified visitors — delivering photo-verified, comparable results within days, without relying on an internal field force.
Know your shelf position before your next retailer negotiation
Roamler gives FMCG brands real, photo-verified Share of Shelf data — across any retail network, in any European market — so you walk into negotiations with facts.
Get in touch