Table of Contents
Definition: What is Planogram Compliance?
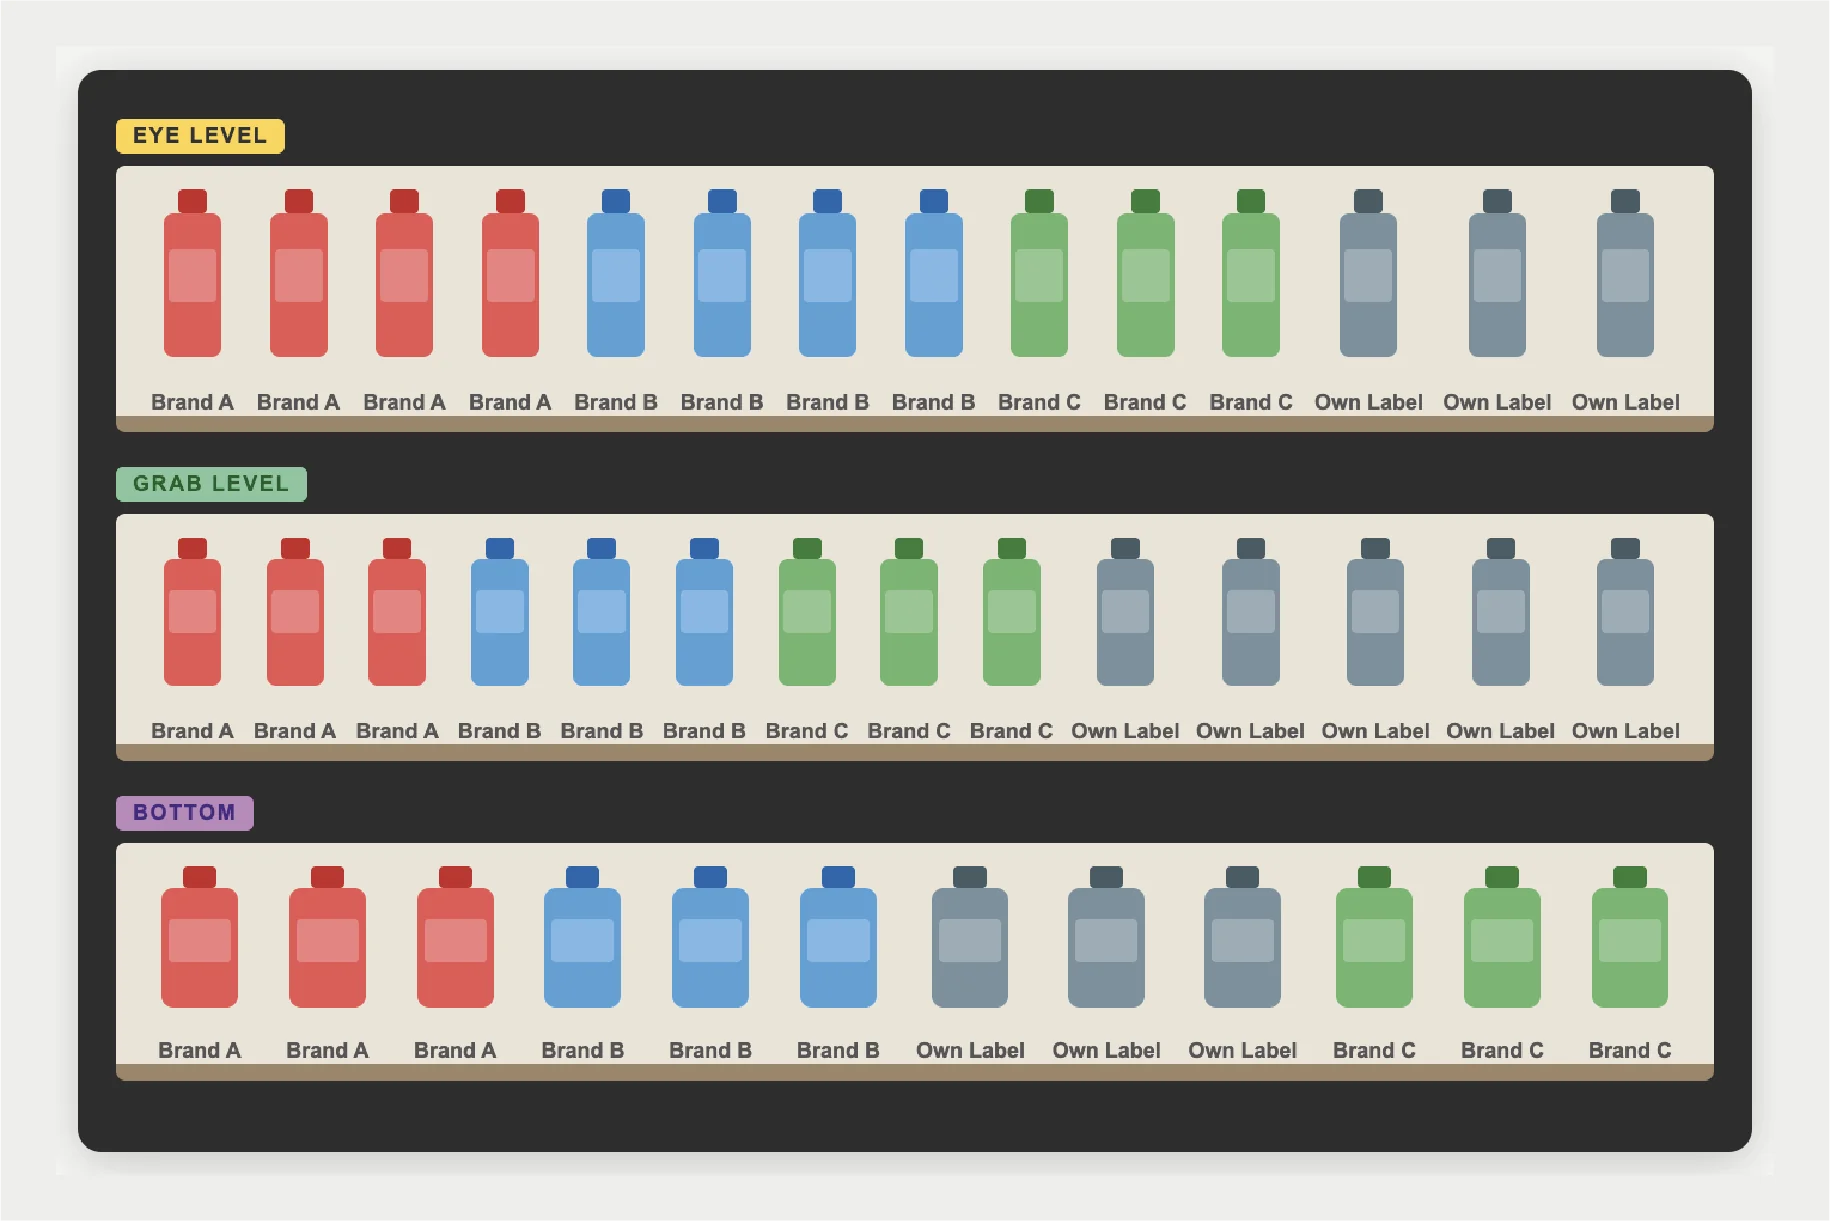
Planogram compliance is the degree to which a product's actual shelf placement in a store matches the agreed planogram: the visual diagram that specifies exactly which SKU goes where, at what shelf height, and with how many facings. It determines:
- Which products are stocked and in which order
- How many facings each SKU receives
- The exact shelf position — height, bay, left-to-right sequence
- Adjacencies — which products sit next to each other
Planogram compliance measures whether that agreed layout is actually being respected in store. A compliance rate of 80% means that 20% of stores are deviating from the agreed shelf plan — generating lost facings, reduced visibility, and in many cases, direct lost sales.
Why Planogram Compliance Matters
📉 Non-compliance directly reduces sales. Shelf position and facing count are among the strongest predictors of in-store purchase. A product moved to a less visible shelf position, or reduced from three facings to one, will sell less — regardless of how strong the brand or the product is. Research consistently shows that each additional facing increases sales probability at the point of purchase.
💶 It represents a return on commercial investment. Planogram negotiations are not free. Brands invest trade marketing budget to secure the right shelf position. Non-compliance means that investment is not delivering its intended return — and in most cases, the brand has no visibility into the fact that it's happening.
🤝 It undermines retailer relationships. When a brand can demonstrate, with photo evidence, that a centrally agreed planogram is not being respected at store level, it transforms the commercial conversation. Data-backed compliance reporting creates accountability on both sides of the relationship.
What Causes Planogram Non-Compliance?
- Local store autonomy. In many retail networks, individual store managers have discretion over how shelves are arranged. Centrally agreed planograms are treated as guidelines rather than mandates.
- Shelf resets that don't happen. A new planogram is issued after a range review, but individual stores don't action the reset — or action it partially. The new layout exists on paper; the old one remains on the shelf.
- Competitor encroachment. Competitors' products expand into adjacent space, reducing the brand's allocated facings without any formal decision being made.
- Seasonal disruptions. Promotional periods, new product introductions, and seasonal resets all create moments where shelf layouts are most likely to be disrupted — precisely when they matter most commercially.
- Stock-driven improvisation. When a product is out of stock, store staff often fill the gap with an adjacent product — and the original planogram is never restored.
Planogram Compliance vs. Share of Shelf: What's the Difference?
These two metrics are related but answer different questions:
| Planogram Compliance | Share of Shelf | |
|---|---|---|
| Question it answers | Is the agreed layout being respected? | How much space does the brand occupy vs. competitors? |
| Benchmark | The agreed planogram | Total category space |
| Best used for | Verifying commercial agreements | Competitive benchmarking and negotiation |
In practice, both are needed. Planogram compliance reveals execution gaps against agreed standards. Share of shelf reveals competitive gaps, including situations where compliance is technically met but competitors have gained disproportionate space in adjacent sections.
How to Improve Planogram Compliance
- Establish a baseline. Run a compliance audit across priority retail networks immediately after a planogram reset — this is when deviations are most likely to be largest and most recent.
- Prioritise by commercial impact. Not all stores carry equal weight. Focus corrective action on the highest-volume outlets where facing loss has the greatest sales impact.
- Use photo evidence in retailer conversations. Aggregate non-compliance data, with photographic proof, creates a factual basis for retailer conversations that is impossible to dispute and difficult to ignore.
- Monitor at peak moments. Compliance is most at risk during new product introductions, promotional resets, and seasonal transitions. Systematic audits at these moments prevent deviations from becoming permanent.
- Close the loop with field action. Compliance data is only valuable if it triggers a corrective visit. The most effective programs connect audit results directly to field team tasking — a non-compliant store generates a visit, a visit generates a correction, a correction is verified with a follow-up photo.
Do you want to measure your planogram compliance?
Roamler helps FMCG brands verify shelf execution across any European point of sale, with photo-verified data delivered within days and corrective actions triggered at store level.
Get in touchSome frequently asked questions
How is planogram compliance calculated?
Typically as a percentage: the number of stores where the agreed shelf layout is correctly implemented, divided by the total number of stores audited. In practice, compliance is rarely binary — a store may be partially compliant, with the correct position but the wrong facing count, for example. The most actionable compliance metrics break the deviation down by type: position errors, facing-count gaps, adjacency violations, and missing SKUs, which tells a commercial team not just how many stores are non-compliant but exactly what needs correcting.
What is a realistic planogram compliance rate for FMCG brands?
Benchmarks vary significantly by category, retail network, and market. In highly managed environments — large grocery chains with strong central merchandising control — compliance rates of 70–85% are common. In more fragmented networks, such as proximity stores, independent retailers, or hard discount, compliance can fall below 50% without systematic monitoring. The most meaningful benchmark isn't an industry average but a brand's own compliance trend over time, and the revenue impact of closing the gap to target.
How often should planogram compliance be audited?
At minimum, immediately after every planogram reset or range review, since that's the highest-risk moment for deviations. For priority SKUs or high-investment placements, continuous monitoring is more appropriate — monthly or even bi-weekly audit waves catch deviations before they compound into sustained sales losses. Cadence should be driven by commercial exposure: the higher the trade investment in a placement, the more frequently it should be verified.
What is the difference between planogram compliance and in-store execution?
Planogram compliance is one component of in-store execution. In-store execution is the broader discipline, covering numeric distribution, out-of-stock management, share of shelf, promotional display installation, and pricing compliance, in addition to planogram adherence. A store can be fully compliant with its planogram and still have poor overall execution — if products are out of stock, promotional displays are missing, or pricing is wrong.