Understanding how a category is actually implemented in-store is essential for a brand. It explains differences in performance between retailers, and it tracks how the shelf and the assortment evolve over time — the real picture on the shelf, which is sometimes very different from the theory of the planogram.
In this article, we use energy drinks to illustrate the indicators worth following.
How we collected the data: our community audited the energy drinks category in 150 French hypermarkets, recording assortment, shelf size, signage and point-of-sale material.
A Wide Range of Products
Long dominated by Red Bull, the energy drinks category has evolved considerably in recent years with the arrival of new players — Rockstar (PepsiCo) in 2021 and V Energy (Suntory) in 2022.
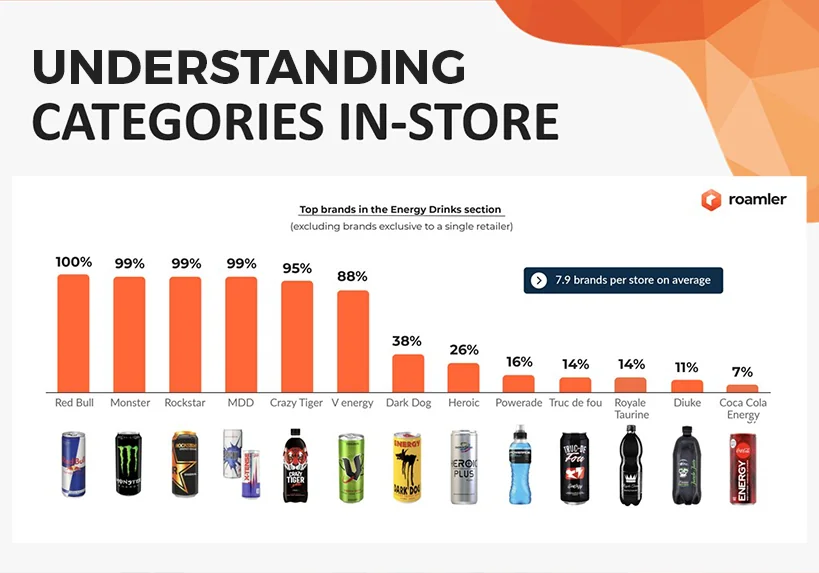
Across the 150 stores audited, we found more than 30 brands in total, and an average of almost 8 brands per store. Five brands are stocked by 95% or more of retailers — Red Bull, Monster, Rockstar and private label are carried almost everywhere, and Crazy Tiger is close behind. V Energy already reaches 88%, just two years after entering the market. Smaller brands fill out the rest of the range, some of them exclusive to a single retailer.
| Brand | Present in stores |
|---|---|
| Red Bull | 100% |
| Monster | 99% |
| Rockstar | 99% |
| Private label | 99% |
| Crazy Tiger | 95% |
| V Energy | 88% |
| Dark Dog | 38% |
| Heroic | 26% |
| Powerade | 16% |
| Truc de Fou | 14% |
| Royale Taurine | 14% |
| Diuke | 11% |
| Coca-Cola Energy | 7% |
Share of the 150 audited hypermarkets stocking each brand, excluding brands available at only one retailer. Average: 7.9 brands per store. Source: Roamler in-store audit, France, Dec 2022.
Wide Differences Between Retailers
The average energy drink shelf runs to two bays. Some retailers allocate considerably more space than others, and the spread between the largest and smallest is substantial.
Shelf size and assortment width do not move together. One of the retailers with the smallest shelves carries an average of nine brands — more than the national average — while another with generous space stocks noticeably fewer. Space allocated and choice offered are two separate decisions, and reading one from the other will mislead you.
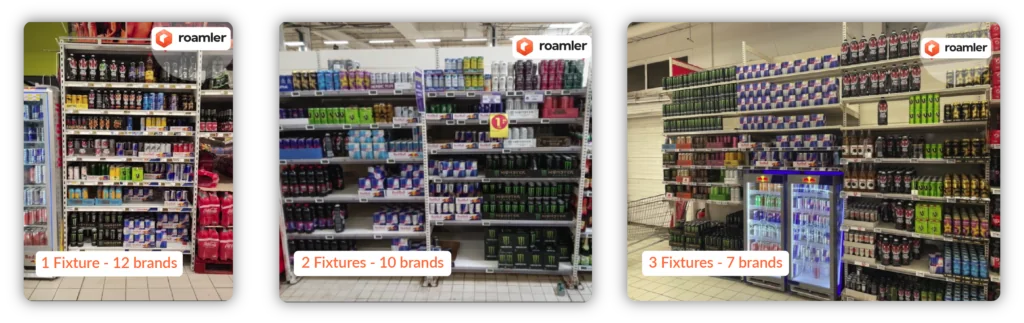
Three shelves from the audit: fixture count and brand count don't move in the same direction.
Signage: An Underused Lever
Category signage — the retailer's own wayfinding that tells a shopper where energy drinks are — is generally well handled in company-owned stores, with one clear exception, but remains rare in franchised and affiliated formats.
Brand point-of-sale material is far more common. Shelf talkers, display units, shelf blades and similar visibility devices appear in around two thirds of stores, consistently across brands. The contrast is worth noting: brands are investing in visibility at shelf, while the retailer-side signage that helps a shopper find the category at all is applied unevenly.
See How Your Category Is Really Implemented
We audit assortment, shelf space, signage and point-of-sale material store by store — so you work from the shelf as it is, not the planogram as it was agreed.
Contact our experts