
FMCG has reached a squeeze point. Operational costs keep pushing margins down, while the room to pass those costs on through price has effectively closed.
Most brands answer that squeeze with the traditional loop: fixed territories, rigid visit schedules. The problem is that this is a contact strategy built on geography rather than opportunity. It treats every store as an equal priority regardless of how that store is performing this week.
Growth does not come from more visits. It comes from better triggers. Here is how EPOS data — electronic point of sale — turns a field team into a targeted one.
What EPOS Data Changes
In a traditional model, a rep visits Store A because it is Tuesday, not because Store A needs them. High operating cost, thin return.
Store-level sell-out data replaces the question. Instead of asking who is due a visit, you ask where the revenue is leaking right now — and you send someone there.
Tracking Patterns, Spotting Anomalies
The method is borrowed from fraud detection in banking, where models are built to catch a single anomalous transaction inside millions of ordinary ones. Applied to shelves, it works in three steps.
- Clustering. Stores with comparable sales patterns are grouped together, so each store is measured against genuine peers rather than a network average.
- Tracking. Those clusters are monitored continuously.
- Detection. When a store diverges from its cluster — sometimes by only a few units — it is flagged.
The output is not a report. Each deviation is converted into Lost Sales Value, so the flag does not just say a store has a problem — it quantifies what the problem costs for every hour it goes unaddressed.
What This Looks Like in Practice
An illustrative scenario. Your products are listed in 600 stores.
In Store #12, your top SKU stops selling for 48 hours. The retailer's system still shows it as in distribution, so from head office nothing looks wrong.
A signal fires and the rep goes straight there. The shelf tag is missing. Staff have closed the gap with a competitor's product. No tag means no scan, no reorder, and no sales. The rep replaces the tag, places the order, and sales restart.
Across our live programmes, roughly 80% of signals turn out to be a genuine issue — the rest are noise the model has not yet learned to filter.
The Same Causes, Over and Over
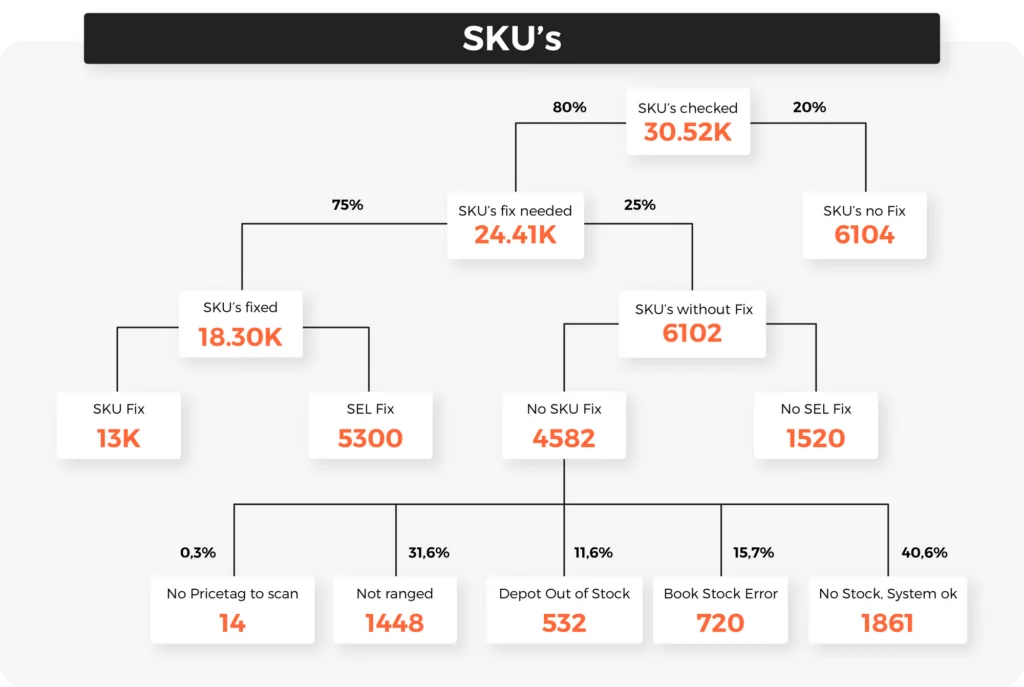
The data shows the same failures recurring across a network.
- The gap filler. A member of staff hides an out-of-stock by spreading other products across the space, which effectively removes your SKU from the shelf.
- Phantom stock. The system records ten units. In reality they were stolen or damaged. Because the system believes the shelf is stocked, it never triggers a reorder.
- The tag ghost. No label, no scan, no revenue.
The Stores That Need You Keep Changing
The stores that need attention today are not the ones that will need it next week. That is the part a fixed route cannot absorb: a rigid team cannot follow a signal that moves.
Which makes flexibility the real capability here — whether that means retooling an internal team or working with a community-based partner to cover the stores your own team cannot reach in time.
Want to See What EPOS Data Could Do for Your Field Team?
We'll walk you through how anomaly detection and Lost Sales Value work against your own network.
Contact us