Table of Contents
Definition: What is Out-of-Stock (OOS)?
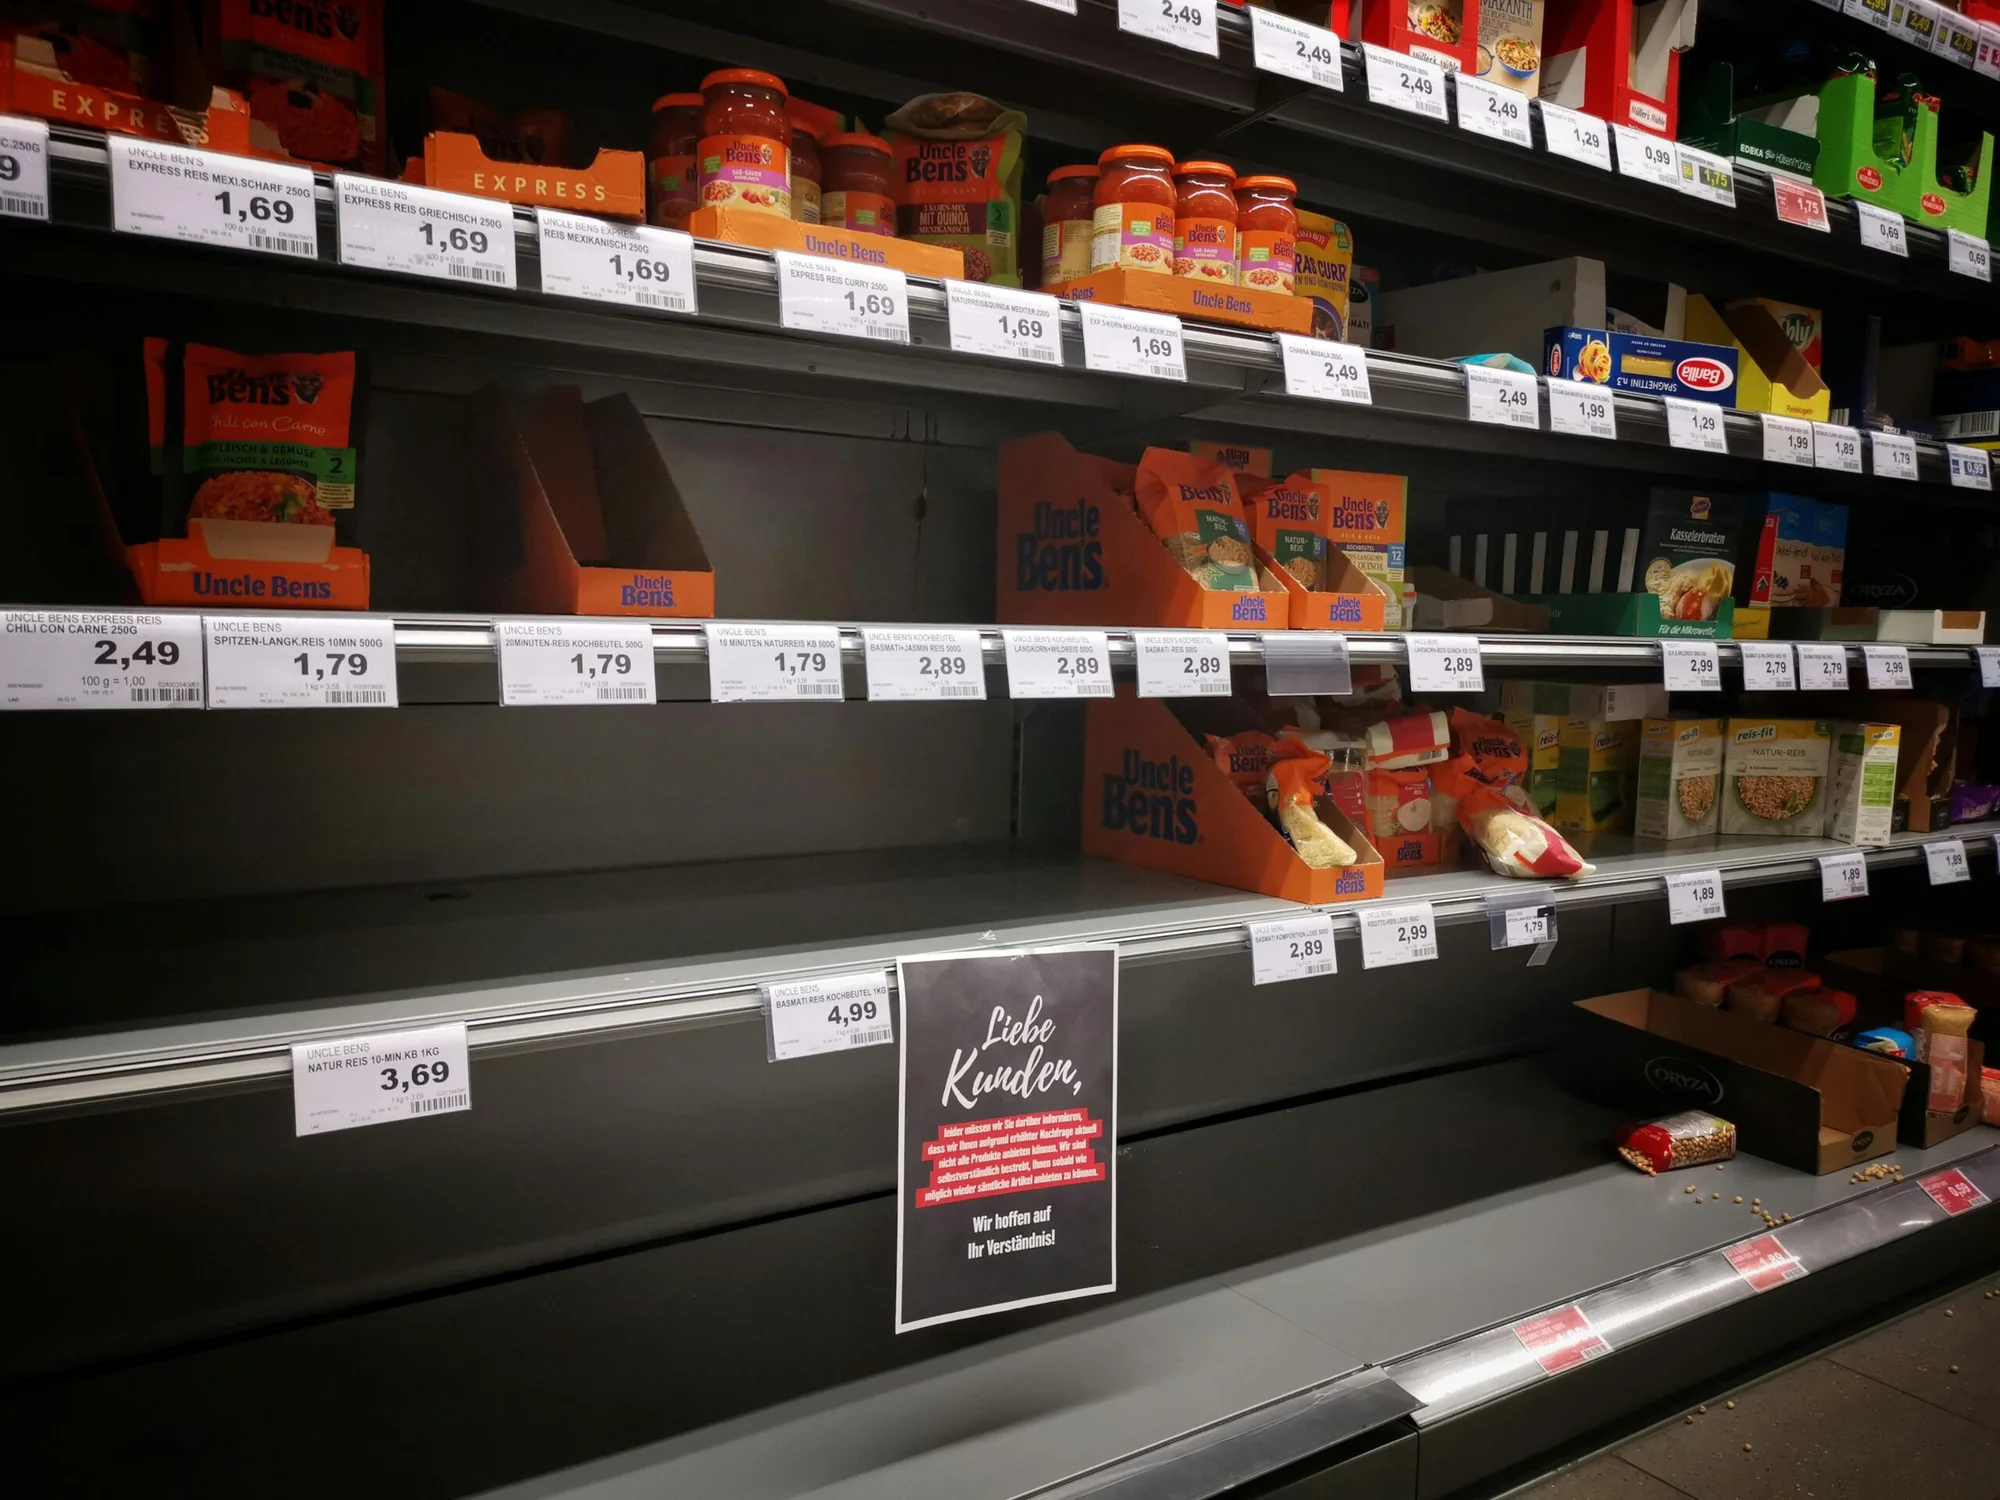
An out-of-stock (OOS) situation occurs when a product that is listed and expected to be available in a store is not physically present on the shelf at the moment a shopper wants to buy it.
OOS is measured as a rate:
Formula: OOS rate (%) = Stores where the product is absent from the shelf ÷ Total stores measured × 100
An OOS rate of 5% means that in 1 in 20 store visits, a shopper looking for the product will find an empty shelf. At the scale of a major FMCG brand operating across thousands of stores, a 5% OOS rate represents an important and calculable revenue loss.
The Commercial Impact of Out-of-Stocks
🛒 Shoppers switch to competitors, and often don't come back. Research consistently shows that the majority of shoppers confronted with an OOS do not wait for the product to be restocked. They buy a competing product instead. In many cases, that switch becomes habitual.
📉 It undermines promotional investment. An OOS during a promotional period is the most commercially damaging scenario: the brand has invested in driving demand, demand is arriving, and the shelf is empty. Trade marketing budget spent generating footfall that converts to a competitor's sale.
🤝 It affects retailer relationships. Persistent OOS situations reduce a brand's commercial standing, jeopardise shelf space allocations, and in severe cases trigger penalties or de-listing discussions.
📊 It distorts sell-out data. A period of zero sales in a store can reflect a genuine lack of demand, or it can reflect an OOS. Without store-level availability data, brands cannot distinguish between the two. This makes sell-out analysis unreliable and promotional ROI measurement misleading.
Types of Out-of-Stock Situations
Not all OOS situations have the same cause, and not all require the same fix.
- Replenishment: The product is in the store's backroom but has not been moved to the shelf (the most common type). Caused by replenishment timing gaps, understaffing, or poor back-of-store organisation.
- Phantom inventory: The store's inventory system shows stock as available, but it is physically absent, misplaced, or damaged. The system doesn't trigger a reorder and the shelf stays empty. This is particularly difficult to detect without physical verification.
- Distribution OOS: The product is not available anywhere in the store. It was never delivered due to a supply chain failure, a forecasting error, or a missed order. Different from a replenishment failure: the stock doesn't exist in the store at all.
- Promotional OOS: Demand spikes during a promotional period outpace the standard replenishment cycle. The most commercially impactful type, and the most preventable with adequate planning and monitoring.
- Permanent (De-listing): The product is no longer ordered by the store, either quietly de-listed by the store manager, or removed from the range following a formal review. This appears as an OOS but is actually a distribution loss, requiring a commercial rather than operational response.
How to Reduce Out-of-Stocks
- Detect early with EPOS analysis. Don't wait for a scheduled field visit to discover an OOS. EPOS-based anomaly detection (flagging stores with sustained zero sales) allows brands to identify availability failures within days and direct corrective action quickly.
- Verify root cause before acting. A replenishment failure, phantom inventory situation, and quiet de-listing all look the same in EPOS data. Physical verification identifies which type of OOS is occurring, and therefore which team needs to act and how.
- Prioritise by revenue impact. Calculate the daily revenue loss per store per OOS SKU. This directs corrective resources to the highest-value gaps first.
- Plan for promotional peaks. OOS rates spike during promotional periods precisely when the commercial cost is highest. Systematic monitoring during campaign windows prevents the most damaging OOS scenarios.
- Use data in retailer conversations. Quantified OOS data (number of stores affected, duration, revenue impact, root cause breakdown) is one of the most effective tools in a commercial conversation about supply chain and replenishment processes.
Stop losing revenue to empty shelves
Whether you need store-level audit coverage, EPOS-based OOS detection, or a unified view across all your data sources, Roamler gives you the visibility and the execution resources to fix your product's availability.
Get in touchSome frequently asked questions
What percentage of products are out of stock on average in grocery retail?
Industry studies consistently put average grocery OOS rates at 5–10% for mainstream FMCG products, spiking significantly during promotions and new launches. For high-velocity SKUs, even a 2–3% OOS rate represents a substantial, quantifiable revenue loss — the more useful benchmark isn't the industry average but a brand's own rate by retailer, format, and SKU.
What is the difference between an out-of-stock and a stockout?
The terms are effectively synonymous in retail usage — both describe a product expected on the shelf that's physically absent. "Out-of-stock" is the term more commonly used in FMCG brand and retailer contexts specifically for shelf-level absence, while "stockout" is sometimes used more broadly for absence anywhere in the supply chain, including at distribution-centre level.
How long does a typical out-of-stock situation last?
Duration varies by root cause and detection method. Replenishment OOS is typically resolved within hours to a day once identified. Phantom inventory can persist for days or weeks without physical detection, since the system never flags it. Distribution-level OOS can last until the next order cycle, which in some store formats means a full week. This is exactly why early, EPOS-based detection matters — the longer any of these goes unnoticed, the greater the cumulative loss.
Can EPOS data alone solve the OOS problem?
EPOS is a powerful detection tool but has real limits — it can flag a store where a product has stopped selling, but it can't confirm what's actually happening on the shelf or why. Phantom inventory in particular is invisible to EPOS, since the system believes stock is available. Physical, store-level verification remains essential for root-cause diagnosis and for building the evidence needed in retailer conversations; the most effective OOS management combines both.