Table of Contents
What Is a Route to Market Strategy in the On-Trade Market?
A route to market (RTM) strategy in the on-trade market is the structured plan that defines how a beverage or food brand reaches its target Foodservice outlets, covering which channels and outlet types to prioritise, how distribution will be built and managed, what field execution looks like, and how performance will be measured.
Unlike retail, where route to market is largely determined by a small number of central buying relationships, the on-trade market requires building distribution outlet by outlet across a highly fragmented market. This makes the RTM strategy both more complex and more competitively decisive: the brands that get it right build distribution positions that are extremely difficult for competitors to replicate.
Let's see how to build a strong route to market strategy.
Step 1: Define Your Market — Map Your Outlet Universe
Before deciding where to go, you need to know what's there. This means building a complete and current picture of your target outlet universe: how many outlets exist in your target geography, what types they are, where they are concentrated, and how the market is evolving.
This is harder than it sounds. The on-trade channel has no central registry: bars, restaurants, cafés, and hotels are independent businesses making their own decisions, with no obligation to appear in any directory. Brands that rely on outdated directories or manual prospecting systematically underestimate their market.
A live outlet database, like Roamler's Foodservice Database of 4M+ European Foodservice outlets, is the foundation of a good market definition. It provides a continuously updated picture of the outlet universe, including new openings, closures, and format shifts, allowing brands to define their total addressable market with precision rather than approximation.
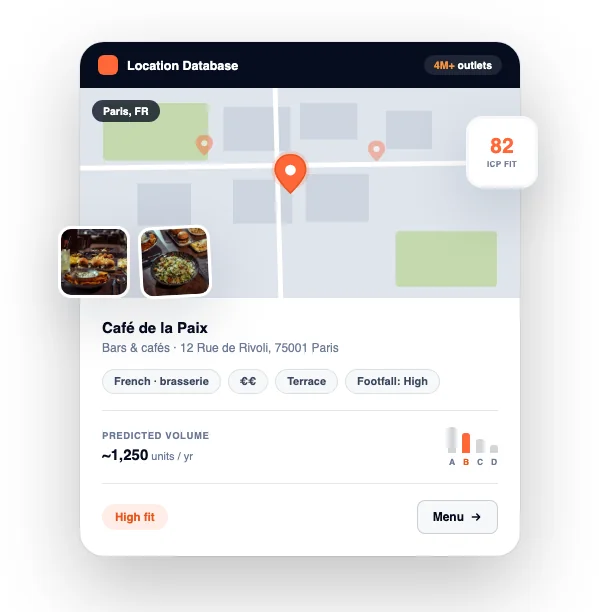
The question to answer at this stage: how many relevant outlets exist in my target market (by type, format, and geography) and how is that universe evolving?
Step 2: Segment and Prioritise
Once the market is defined, divide the outlet universe into meaningful groups based on commercial potential, brand fit, and strategic priority. In the on-trade, market segmentation is a game changer: you need to know where to sell your product and how, and only then can you match the right portfolio to the right outlet.
Effective outlet segmentation considers:
| What to look at | |
|---|---|
| Outlet type | Bar, restaurant, café, hotel, stadium, canteen |
| Price positioning | Budget, mid-market, premium |
| Consumer profile | Who goes there, and does it match the brand's target consumer? |
| Volume potential | Footfall, covers, opening hours |
| Strategic value | Flagship outlets that build brand visibility vs. volume outlets that drive rate of sale |
The question to answer at this stage: which outlets represent the highest-priority targets, and in what order should they be activated?
Step 3: Define Your Activation Standards
Distribution is also getting a product properly activated. Hotels, restaurants, and cafés buy differently from retail outlets, need different service levels, and reward brands that show up with the right product, consistency, and execution. A well-defined activation standard typically covers:
- Which SKUs are listed and in what format (draught, bottle, can, portion)
- How the product is served: temperature, glassware, garnish (the "perfect serve")
- Where the product is visible: back bar, menu positioning, table presence
- Whether staff know and recommend the product
- What promotional mechanics are in place — featured serve, seasonal menu placement, brand visibility material
The question to answer at this stage: what does a successfully activated outlet look like, and how will we verify it?
Step 4: Track Your KPIs
A strong RTM strategy starts with measurement to ensure every investment pays off. Some key metrics to track include:
- Outlet coverage rate: the percentage of target outlets visited by the field team within a defined period.
- Activation quality score: the degree to which each activated outlet meets the defined activation standards.
- Rate of sale: volume sold per outlet per period. The commercial output metric that validates whether distribution and activation are generating actual revenue.
- White space coverage: the percentage of high-priority uncovered outlets activated over a defined period.
Tracking these KPIs consistently requires the right data infrastructure: a live outlet database to define the market (check our Foodservice Database), SFA tools to capture field data on every visit (check our Salesmapp), and market monitoring to detect changes before they affect performance.
Roamler supports major brands in their on-trade development
From market mapping to field activation, Roamler provides the outlet data, SFA tools, and execution intelligence to build and scale on-trade presence across Europe.
Request infoSome frequently asked questions
What is the difference between route to market and distribution strategy?
Distribution strategy is one component of a route to market strategy. Distribution covers how products physically reach the outlet. Route to market is broader: it encompasses market definition, outlet segmentation and prioritisation, the distribution model, activation standards, and performance measurement. In the on-trade, the most common mistake is treating route to market as purely a distribution question, focusing on logistics and coverage while neglecting segmentation, activation quality, and measurement.
How do you measure the success of an on-trade RTM strategy?
The most important metrics are numeric distribution or ND (the percentage of target outlets where the brand is listed), activation quality score (how well each outlet meets the brand's activation standards), rate of sale (volume per outlet per period), and white space coverage (the percentage of priority uncovered outlets activated over time).
How often should an on-trade RTM strategy be reviewed?
At minimum, annually, aligned with commercial planning cycles. In practice, the outlet universe and competitive landscape change fast enough to warrant more frequent review of specific components. The outlet segmentation and prioritisation model should be refreshed whenever significant market shifts occur: a new outlet format emerging rapidly, a competitor activating aggressively in a previously underdeveloped segment, or a change in the brand's own portfolio or positioning. A live outlet database, like Roamler's Foodservice Database, makes this continuous review possible without requiring a full strategic reset each time.