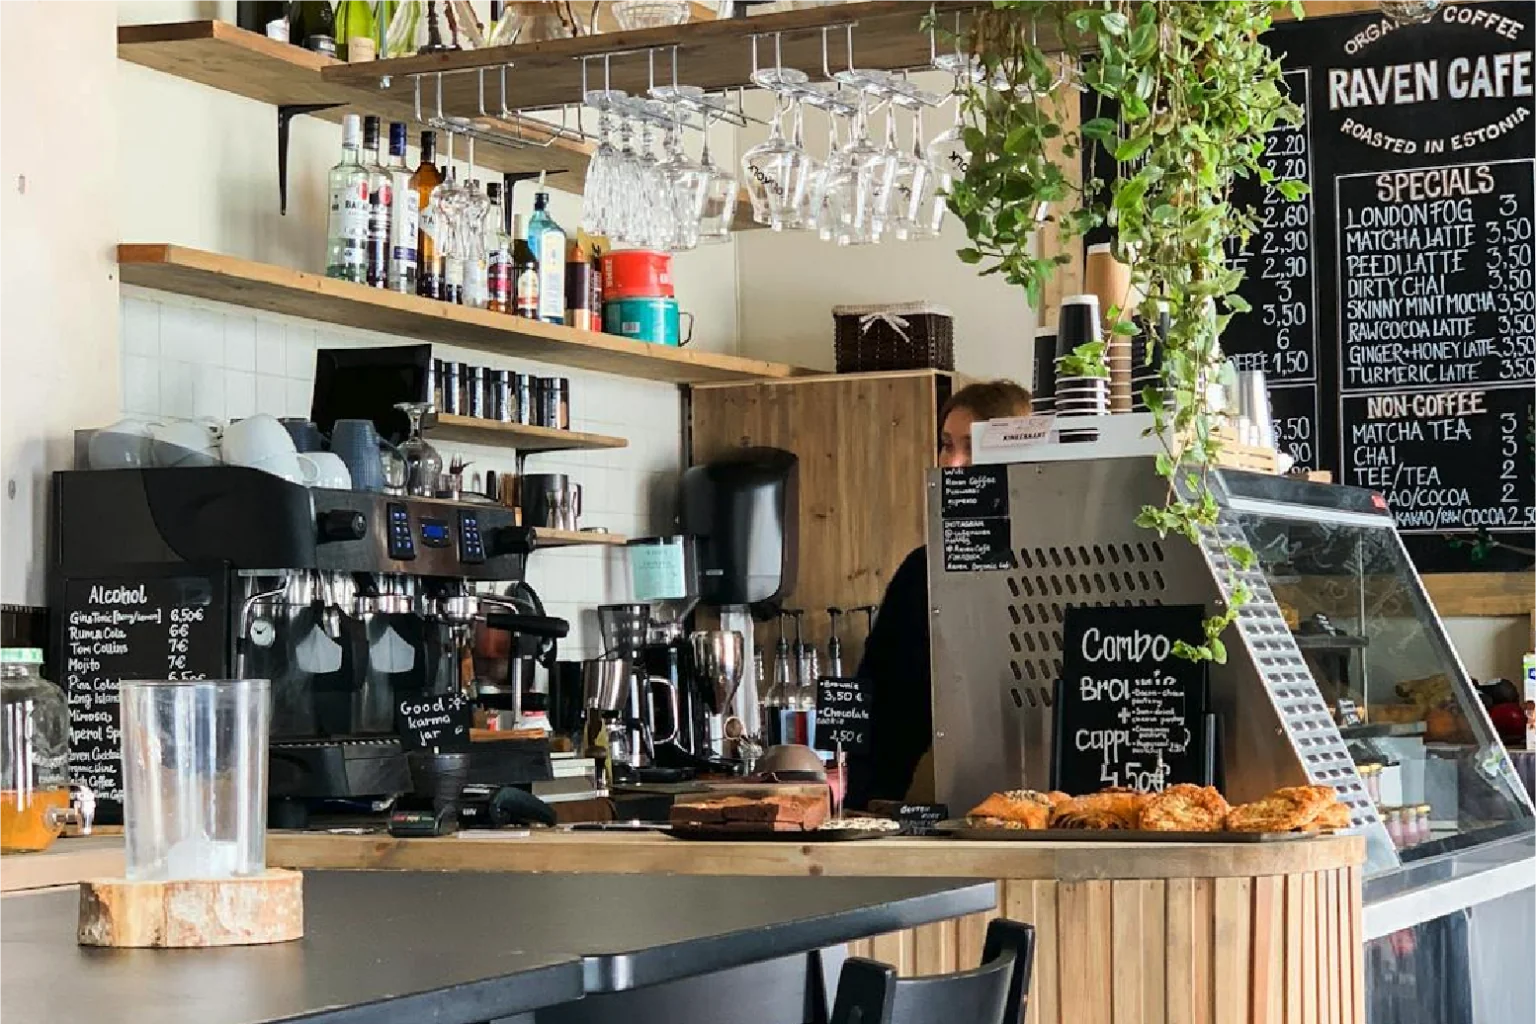
HoReCa is a contraction of the three segments it covers: HOtels, REstaurants and CAfés. It matters to FMCG companies because these outlets buy consumer goods in volume — food, beverages, cleaning products and more.
Scope: all figures below compare active outlets in April 2024 against November 2023, unless stated otherwise. Source: Roamler Foodservice Database.
An Overall Decline
The total number of active HoReCa outlets fell 1.4% over the six months. Several factors are pulling in the same direction: consumers cutting back on discretionary spending, rising competition between outlets, and regulatory pressure — notably the repayment of Covid loans, which fell due in February.
| Month | Active outlets |
|---|---|
| November 2023 | 52,488 |
| December 2023 | 52,433 |
| January 2024 | 52,254 |
| February 2024 | 51,923 |
| March 2024 | 51,867 |
| April 2024 | 51,765 |
Which Segments Are Most Affected?
The decline is not spread evenly. Bars and pubs, coffee bars and takeaway or delivery outlets all fell by around 2%. Ice cream parlours dropped 3.4%, but that figure needs treating with care — these outlets are typically less active over the winter, so the summer reading will be the one worth watching.
| Segment | Change |
|---|---|
| Ice cream parlour | −3.4% |
| Bar / pub | −2.2% |
| Coffee bar | −2.0% |
| Take away / delivery | −1.9% |
| Restaurant – social dining | −1.6% |
| Fast food – salads/pasta/noodles | −1.3% |
| Lunch / sandwiches | −0.6% |
| Fast food – shawarma/kebab | −0.5% |
| Hotel / motel | −0.9% |
| Fast food – snacks & fries | −0.1% |
| Restaurant – fast casual | +0.5% |
Fast casual is the exception, up 0.5%. As we have found in previous articles, it remains one of the most dynamic and resilient segments in the market.
Differences Between Provinces
Every province is down, but the spread is wide. South Holland and Groningen fell furthest at 2.3%, while Zeeland held up best with a 0.7% decline. Hover over the map for the full picture.
Set Against the 2023 Average
Widening the frame and comparing current outlet counts against the 2023 average changes which segment looks worst. On that basis, social dining restaurants take the largest hit, down 208 outlets. Fast casual again runs the other way, up 30.
| Segment | Outlets |
|---|---|
| Social dining restaurants | −208 |
| Fast casual restaurants | +30 |
Conclusion
Dutch HoReCa has contracted noticeably over six months. Bars and pubs, coffee bars and takeaway have taken the heaviest losses, while fast casual has held its ground and grown slightly. The provincial spread is wide enough that a national figure tells you very little about any given territory — which is the argument for building strategy locally rather than nationally.
All of which makes current outlet data the practical requirement here. A rep sent to a location that closed three months ago is a visit paid for twice.
Discover the Full Potential of Your Market
Our Foodservice Database covers key location information across 30+ attributes, updated continuously — so your team works from the market as it is today.
Discover the Foodservice Database