Table of Contents
- Definition: What is Out-of-Stock (OOS)?
- The Commercial Impact of Out-of-Stocks
- Types of Out-of-Stock Situations
- How to Check On-Shelf Availability Across Hundreds of Stores
- Sales Data or Store Checks?
- How to Reduce Out-of-Stocks
- European Out-of-Stock Data
- What Roamler's Store Checks Show
- How Roamler Helps
- Some frequently asked questions
Definition: What is Out-of-Stock (OOS)?
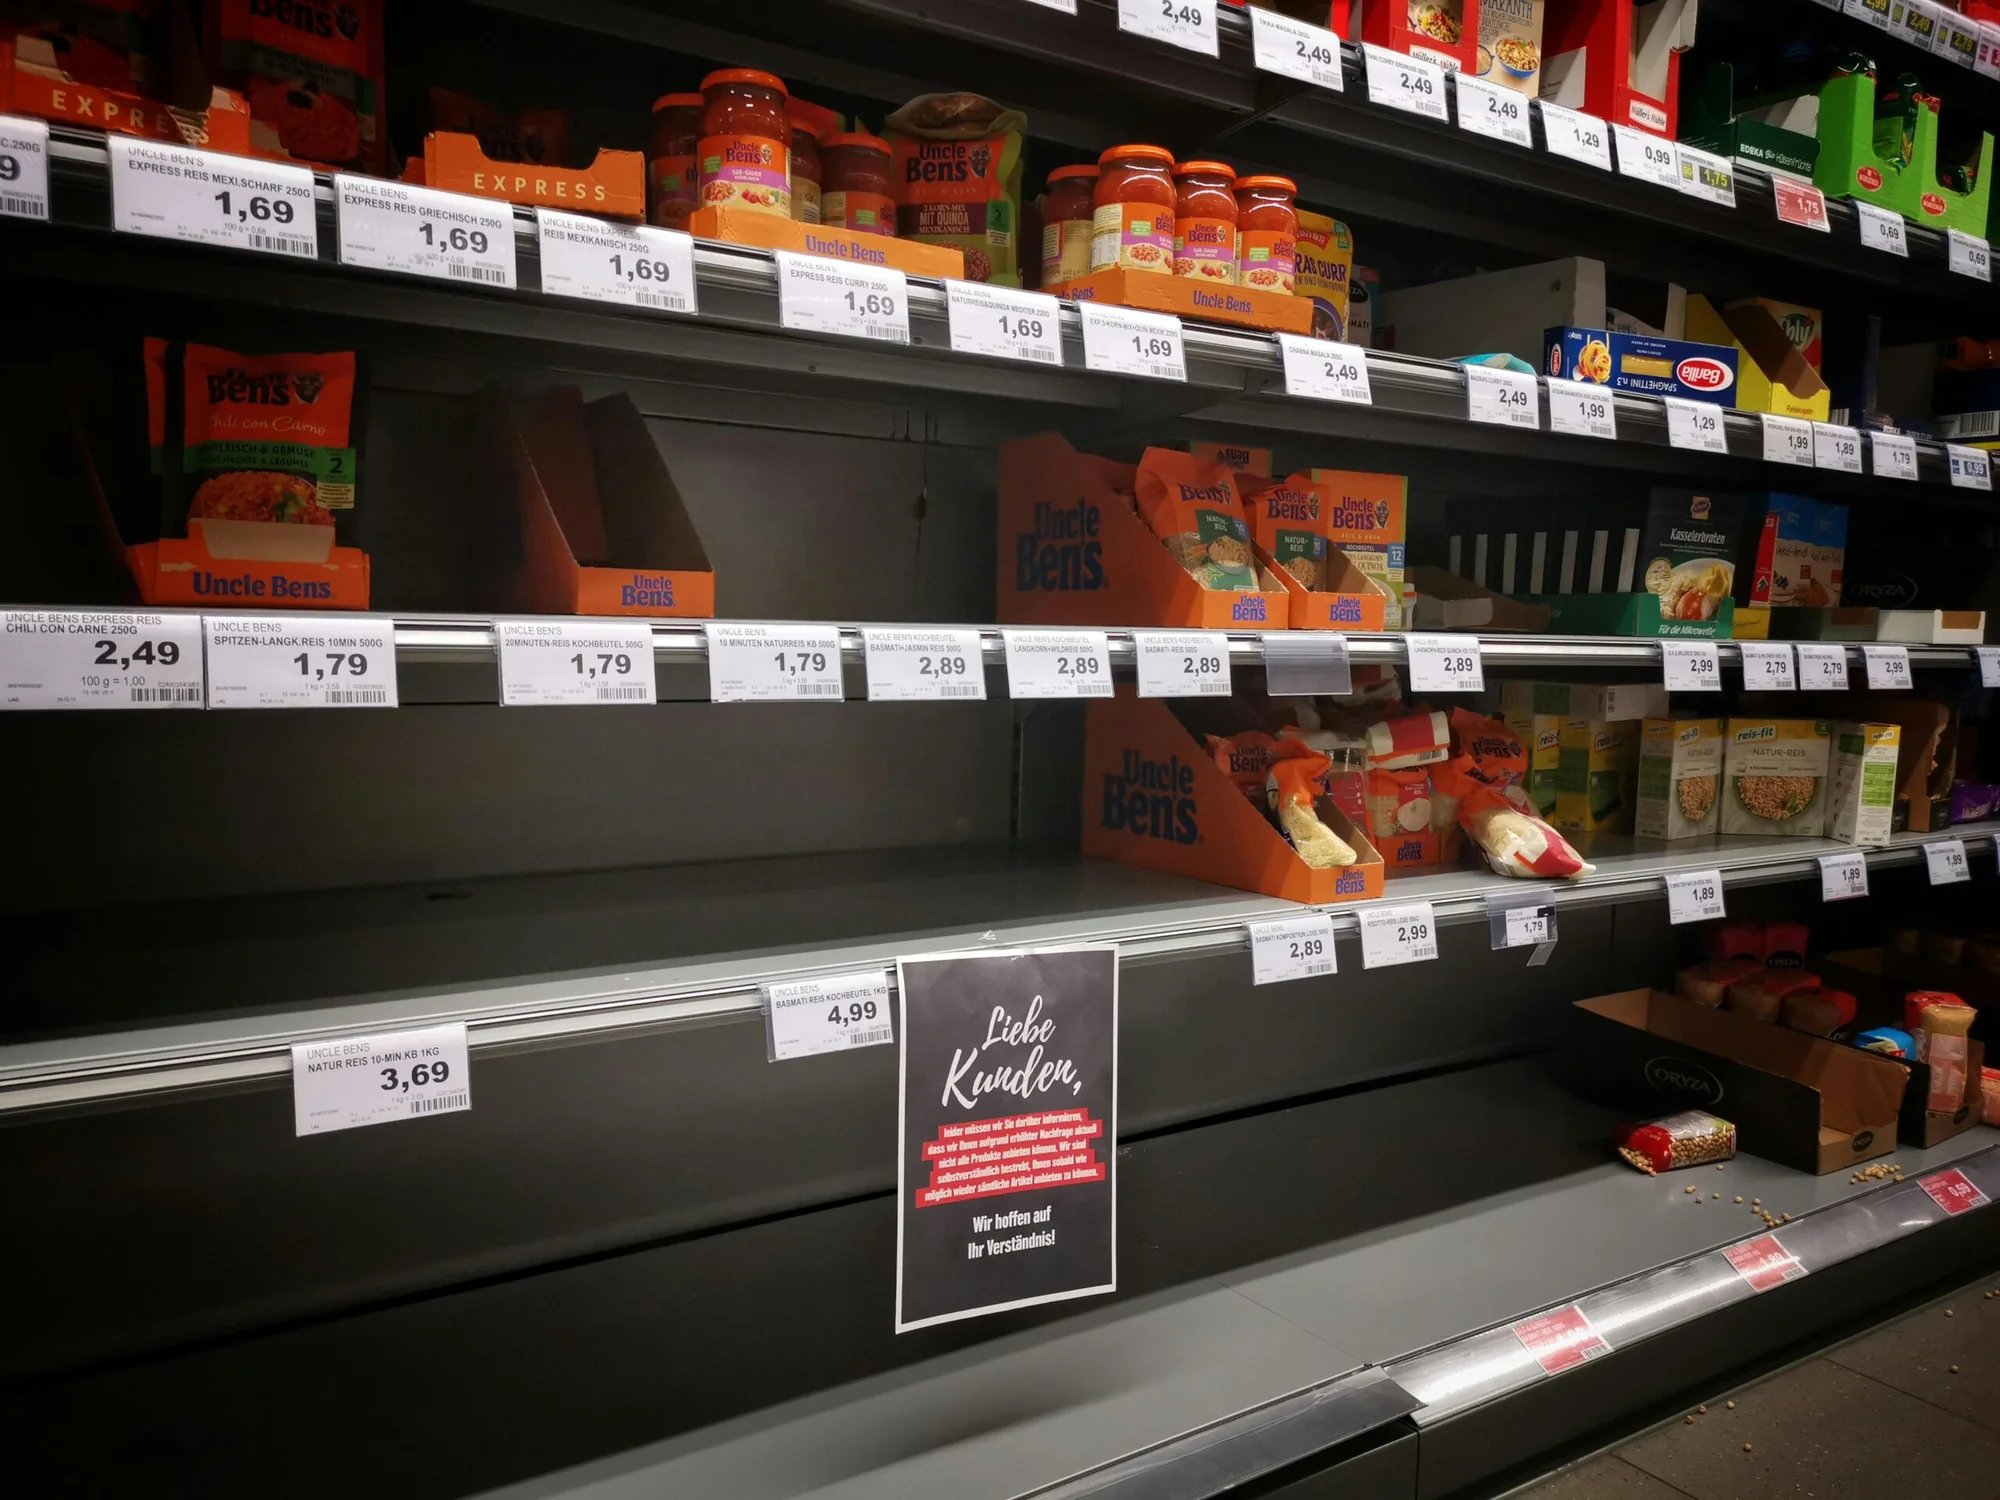
An out-of-stock (OOS) situation occurs when a product that is listed and expected to be available in a store is not physically present on the shelf at the moment a shopper wants to buy it.
OOS is measured as a rate:
Formula: OOS rate (%) = Stores where the product is absent from the shelf ÷ Total stores measured × 100
An OOS rate of 5% means that in 1 in 20 store visits, a shopper looking for the product will find an empty shelf. At the scale of a major FMCG brand operating across thousands of stores, a 5% OOS rate represents an important and calculable revenue loss.
The opposite measure is on-shelf availability (OSA): the share of stores where the product is on the shelf. An OOS rate of 5% means an on-shelf availability of 95%. Retailers and brands often use OSA as their main availability KPI.
The Commercial Impact of Out-of-Stocks
🛒 Shoppers switch to competitors, and often don't come back. Research consistently shows that the majority of shoppers confronted with an OOS do not wait for the product to be restocked. They buy a competing product instead. In many cases, that switch becomes habitual.
📉 It undermines promotional investment. An OOS during a promotional period is the most commercially damaging scenario: the brand has invested in driving demand, demand is arriving, and the shelf is empty. Trade marketing budget spent generating footfall that converts to a competitor's sale.
🤝 It affects retailer relationships. Persistent OOS situations reduce a brand's commercial standing, jeopardise shelf space allocations, and in severe cases trigger penalties or de-listing discussions.
📊 It distorts sell-out data. A period of zero sales in a store can reflect a genuine lack of demand, or it can reflect an OOS. Without store-level availability data, brands cannot distinguish between the two. This makes sell-out analysis unreliable and promotional ROI measurement misleading.
Types of Out-of-Stock Situations
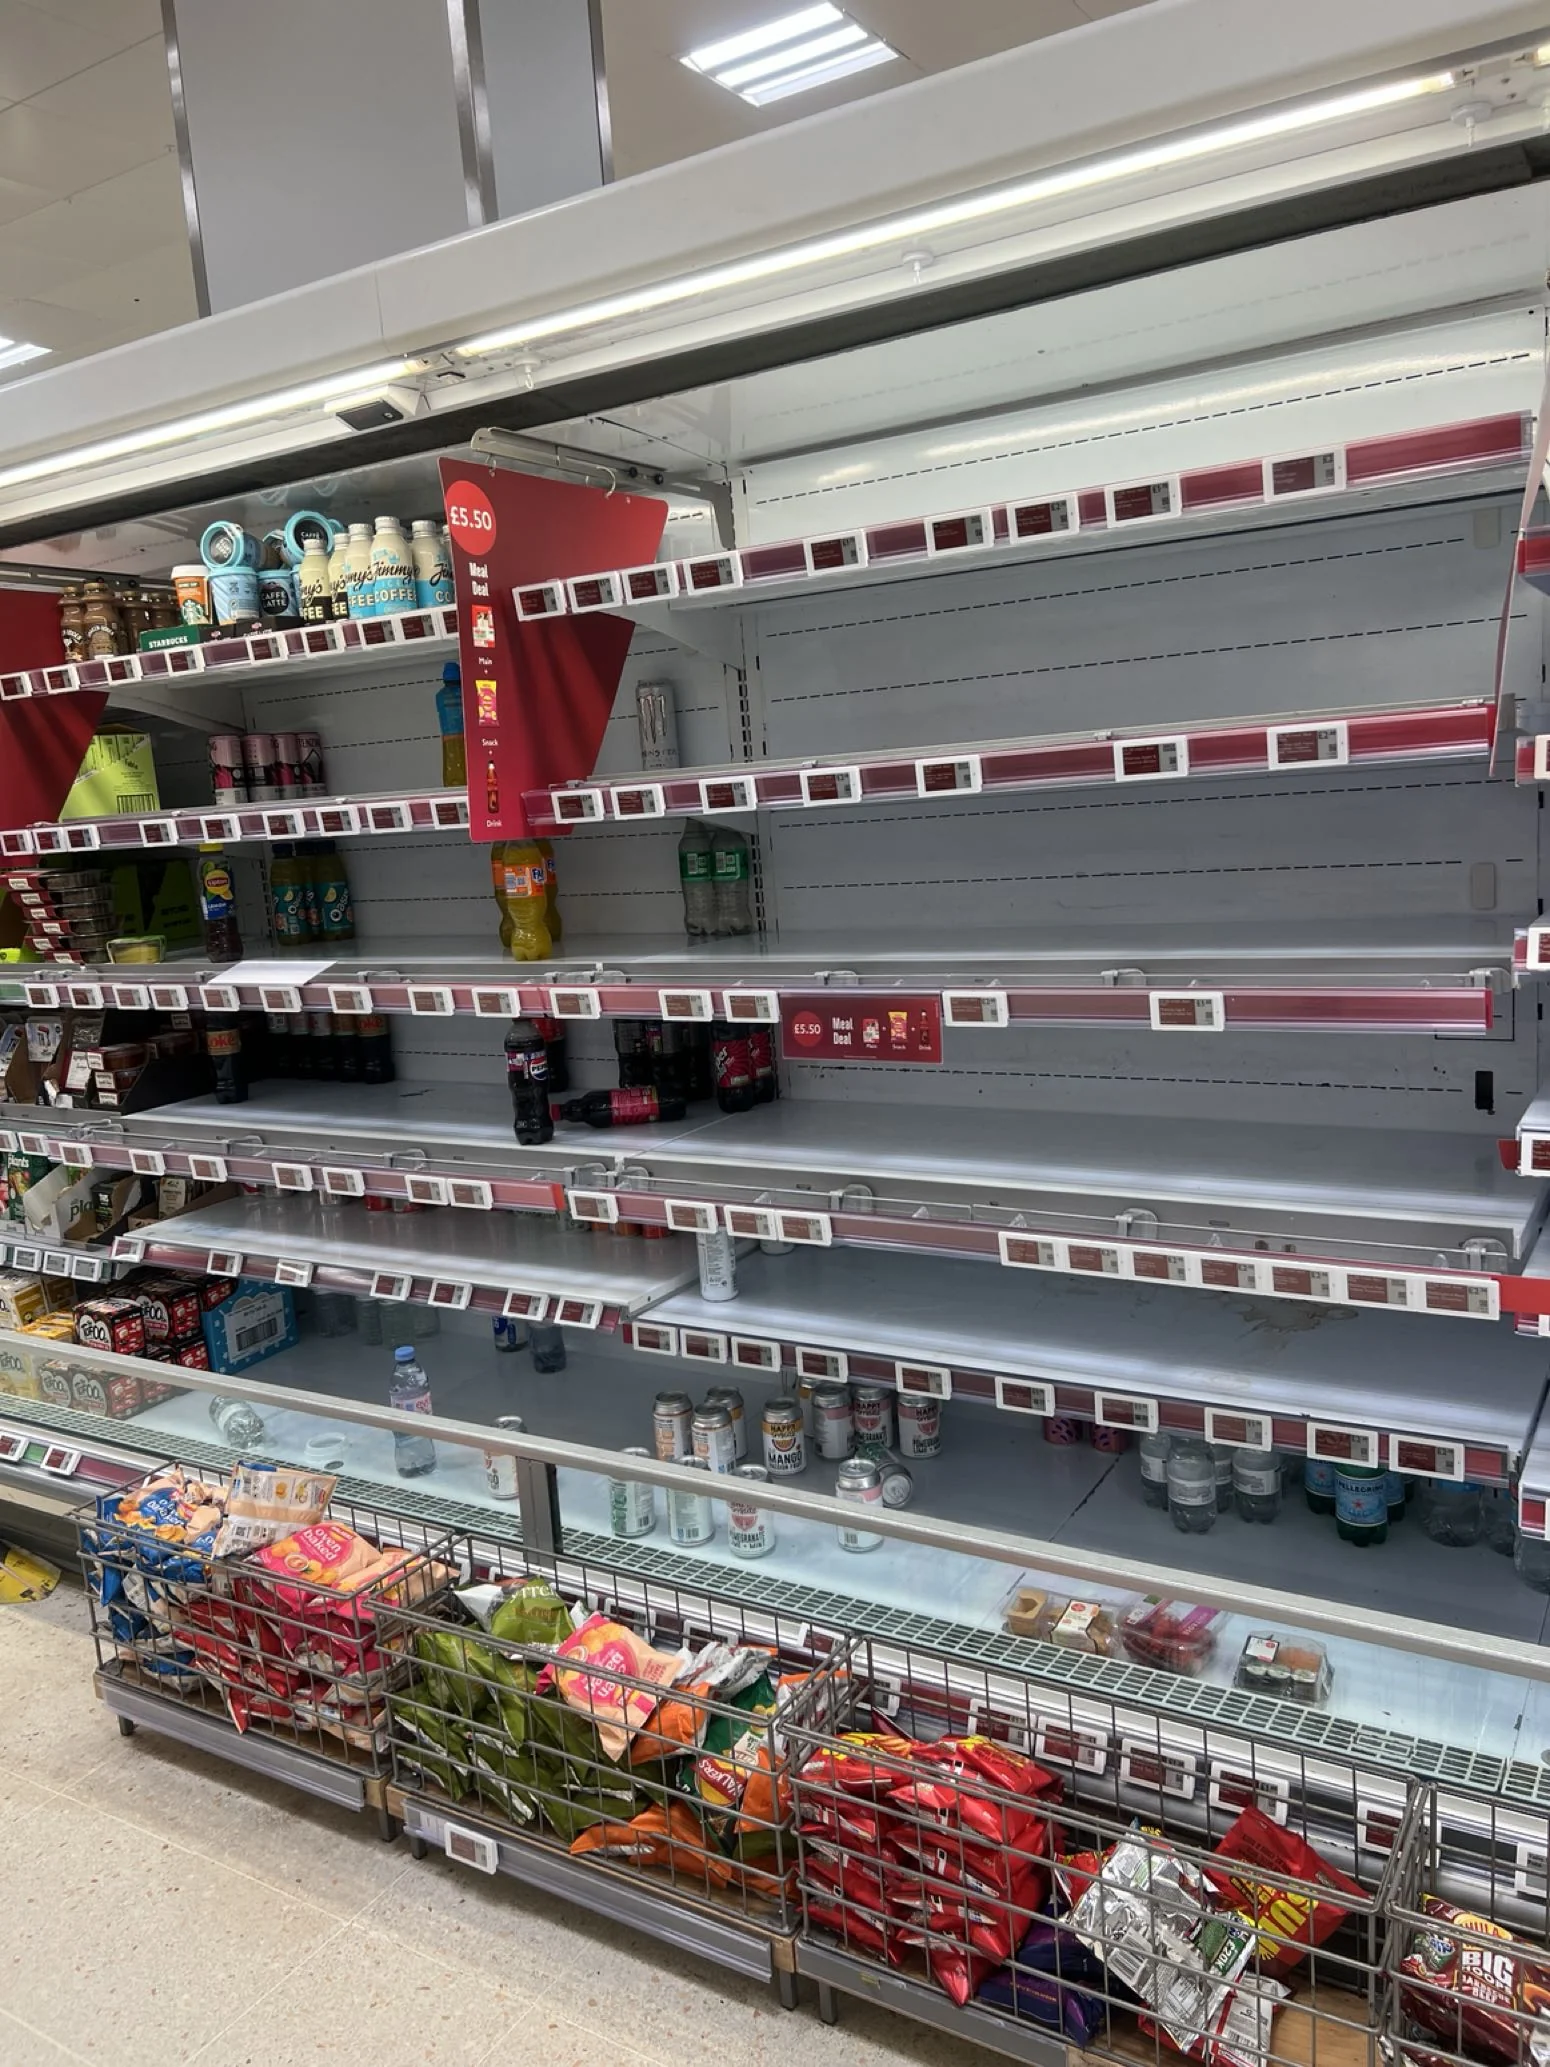
Not all OOS situations have the same cause, and not all require the same fix.
- Replenishment: The product is in the store's backroom but has not been moved to the shelf (the most common type). Caused by replenishment timing gaps, understaffing, or poor back-of-store organisation.
- Phantom inventory: The store's inventory system shows stock as available, but it is physically absent, misplaced, or damaged. The system doesn't trigger a reorder and the shelf stays empty. This is particularly difficult to detect without physical verification.
- Distribution OOS: The product is not available anywhere in the store. It was never delivered due to a supply chain failure, a forecasting error, or a missed order. Different from a replenishment failure: the stock doesn't exist in the store at all.
- Promotional OOS: Demand spikes during a promotional period outpace the standard replenishment cycle. The most commercially impactful type, and the most preventable with adequate planning and monitoring.
- Permanent (De-listing): The product is no longer ordered by the store, either quietly de-listed by the store manager, or removed from the range following a formal review. This appears as an OOS but is actually a distribution loss, requiring a commercial rather than operational response.
How to Check On-Shelf Availability Across Hundreds of Stores
No brand can check every product in every store every day. Brands that manage availability well follow the same basic process.
- Choose the products to check. Focus on the SKUs that matter most for sales: best sellers, new launches and products on promotion.
- Choose the stores. Use sales data to flag stores where a product has stopped selling, and add a sample of other stores to get a fair picture of the whole network.
- Check at the right time. Out-of-stocks are more frequent at the end of the week, in the evening, and during promotions. A check on a Monday morning, just after the shelves have been filled, will underestimate the problem.
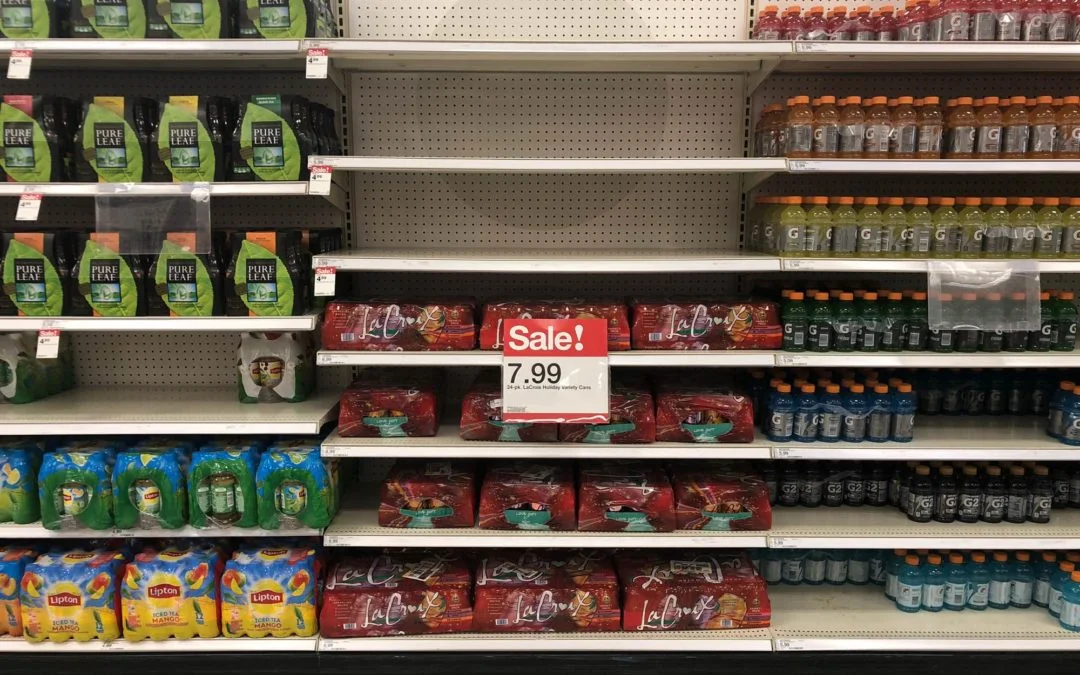
- Check the shelf in store. Someone visits the store, takes a photo of the shelf and answers a few questions: is the product on the shelf? Is the price tag still there? Is there stock in the backroom? This tells you not only whether the product is missing, but why.
- Sort the out-of-stocks by type. A product in the backroom needs a replenishment fix. A missing price tag can mean the product has been de-listed. A product missing from the whole store points to a delivery or ordering problem. Each type needs a different team to act.
- Act and check again. Send the results to the people who can fix them: the store, the retailer's supply team, your sales team or a merchandiser. Then check the same stores again to confirm the product is back.
Sales Data or Store Checks?
Sales data (EPOS) is the fastest way to spot a problem: it shows stores where a product has stopped selling, across the whole network and at low cost. But it cannot show what is happening on the shelf. A product may be in the backroom, delisted, or recorded as in stock when it is not. Retailer availability reports have the same limit, because they rely on the same systems.
A store check fills that gap. Someone visits the store, confirms whether the product is on the shelf, and finds the cause. The most effective approach combines the two: sales data shows where to look, and store checks confirm what is happening and who needs to act. Shelf cameras can do both in real time, but only in the stores where a retailer has installed them.
How to Reduce Out-of-Stocks
- Prioritise by revenue impact. Calculate the daily revenue loss per store per OOS SKU. This directs corrective resources to the highest-value gaps first.
- Plan for promotional peaks. OOS rates spike during promotional periods precisely when the commercial cost is highest. Systematic monitoring during campaign windows prevents the most damaging OOS scenarios.
- Use data in retailer conversations. Quantified OOS data (number of stores affected, duration, revenue impact, root cause breakdown) is one of the most effective tools in a commercial conversation about supply chain and replenishment processes.
European Out-of-Stock Data
According to a study conducted by the Grocery Manufacturers Association (GMA), the European out-of-stock (OOS) rate is around 8.6%. This increases during early evening hours and on specific days of the week — most OOS situations occur on Sunday. During the week, restocking and preparation for Saturday and Sunday promotions keep the rate lower. Although Saturday is the busiest day for grocery shopping, it has the lowest OOS rate, as retailers normally put on extra staff to replenish shelves and stocks of promotional items.
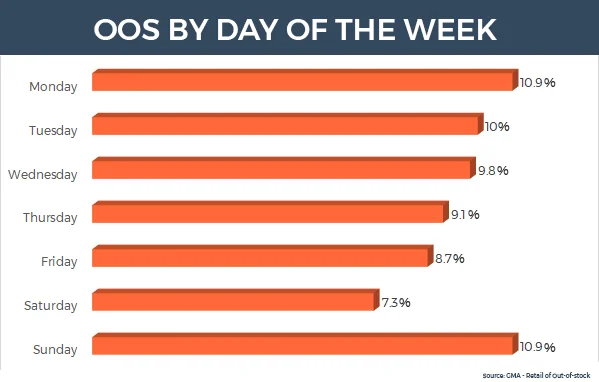
The Factors Influencing OOS
Promotions strongly influence out-of-stock rates. According to several studies conducted over the years, OOS rates tend to be twice as high on promoted items. In general, the amount of discount offered during a promotion corresponds to the OOS rate.
The velocity of product movement is another factor. Fast-moving goods — whether promoted or not — tend to have an OOS rate 50% to 80% higher than other products.
How Do Consumers Respond to OOS Situations?
There are five primary responses when the product a shopper intends to buy is out of stock:
- Buy the item at another store
- Postpone the purchase at the same store
- Substitute the item with a different size or type of the same brand
- Switch to a similar product from another brand
- Do not purchase the item at all
Every one of these responses has negative consequences and results in losses for both retailers and manufacturers. Worldwide, the average sales loss due to OOS is 3.9%.
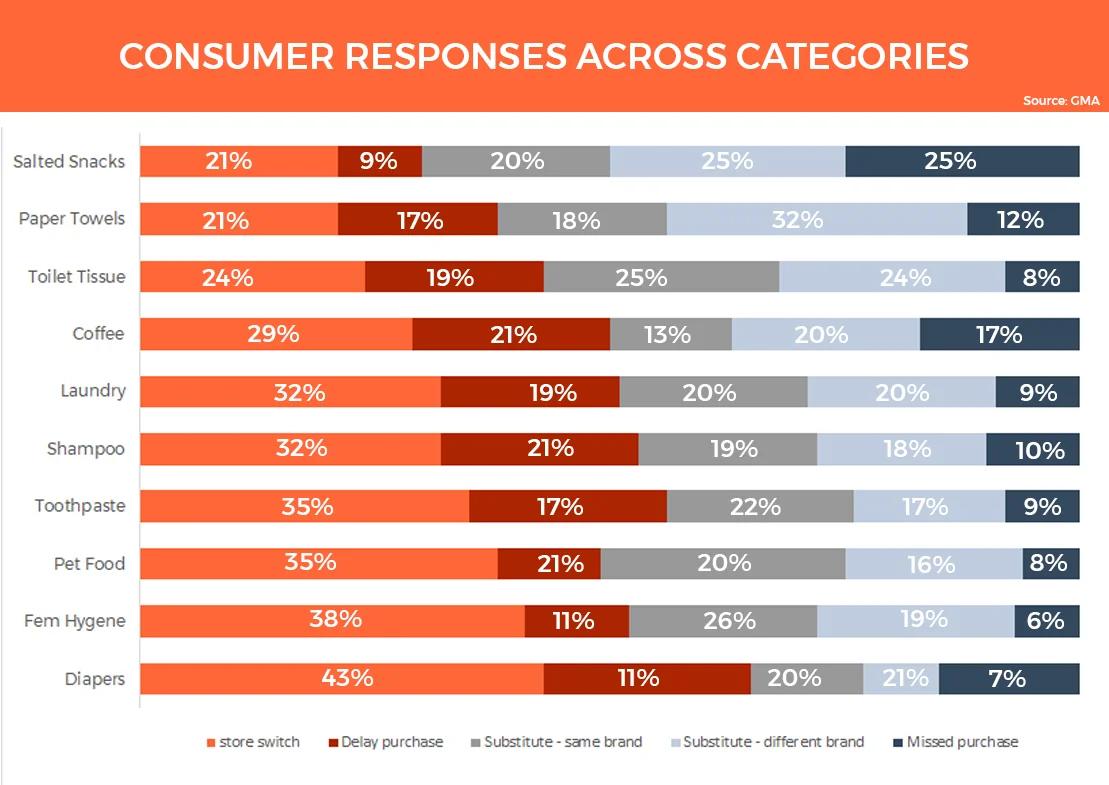
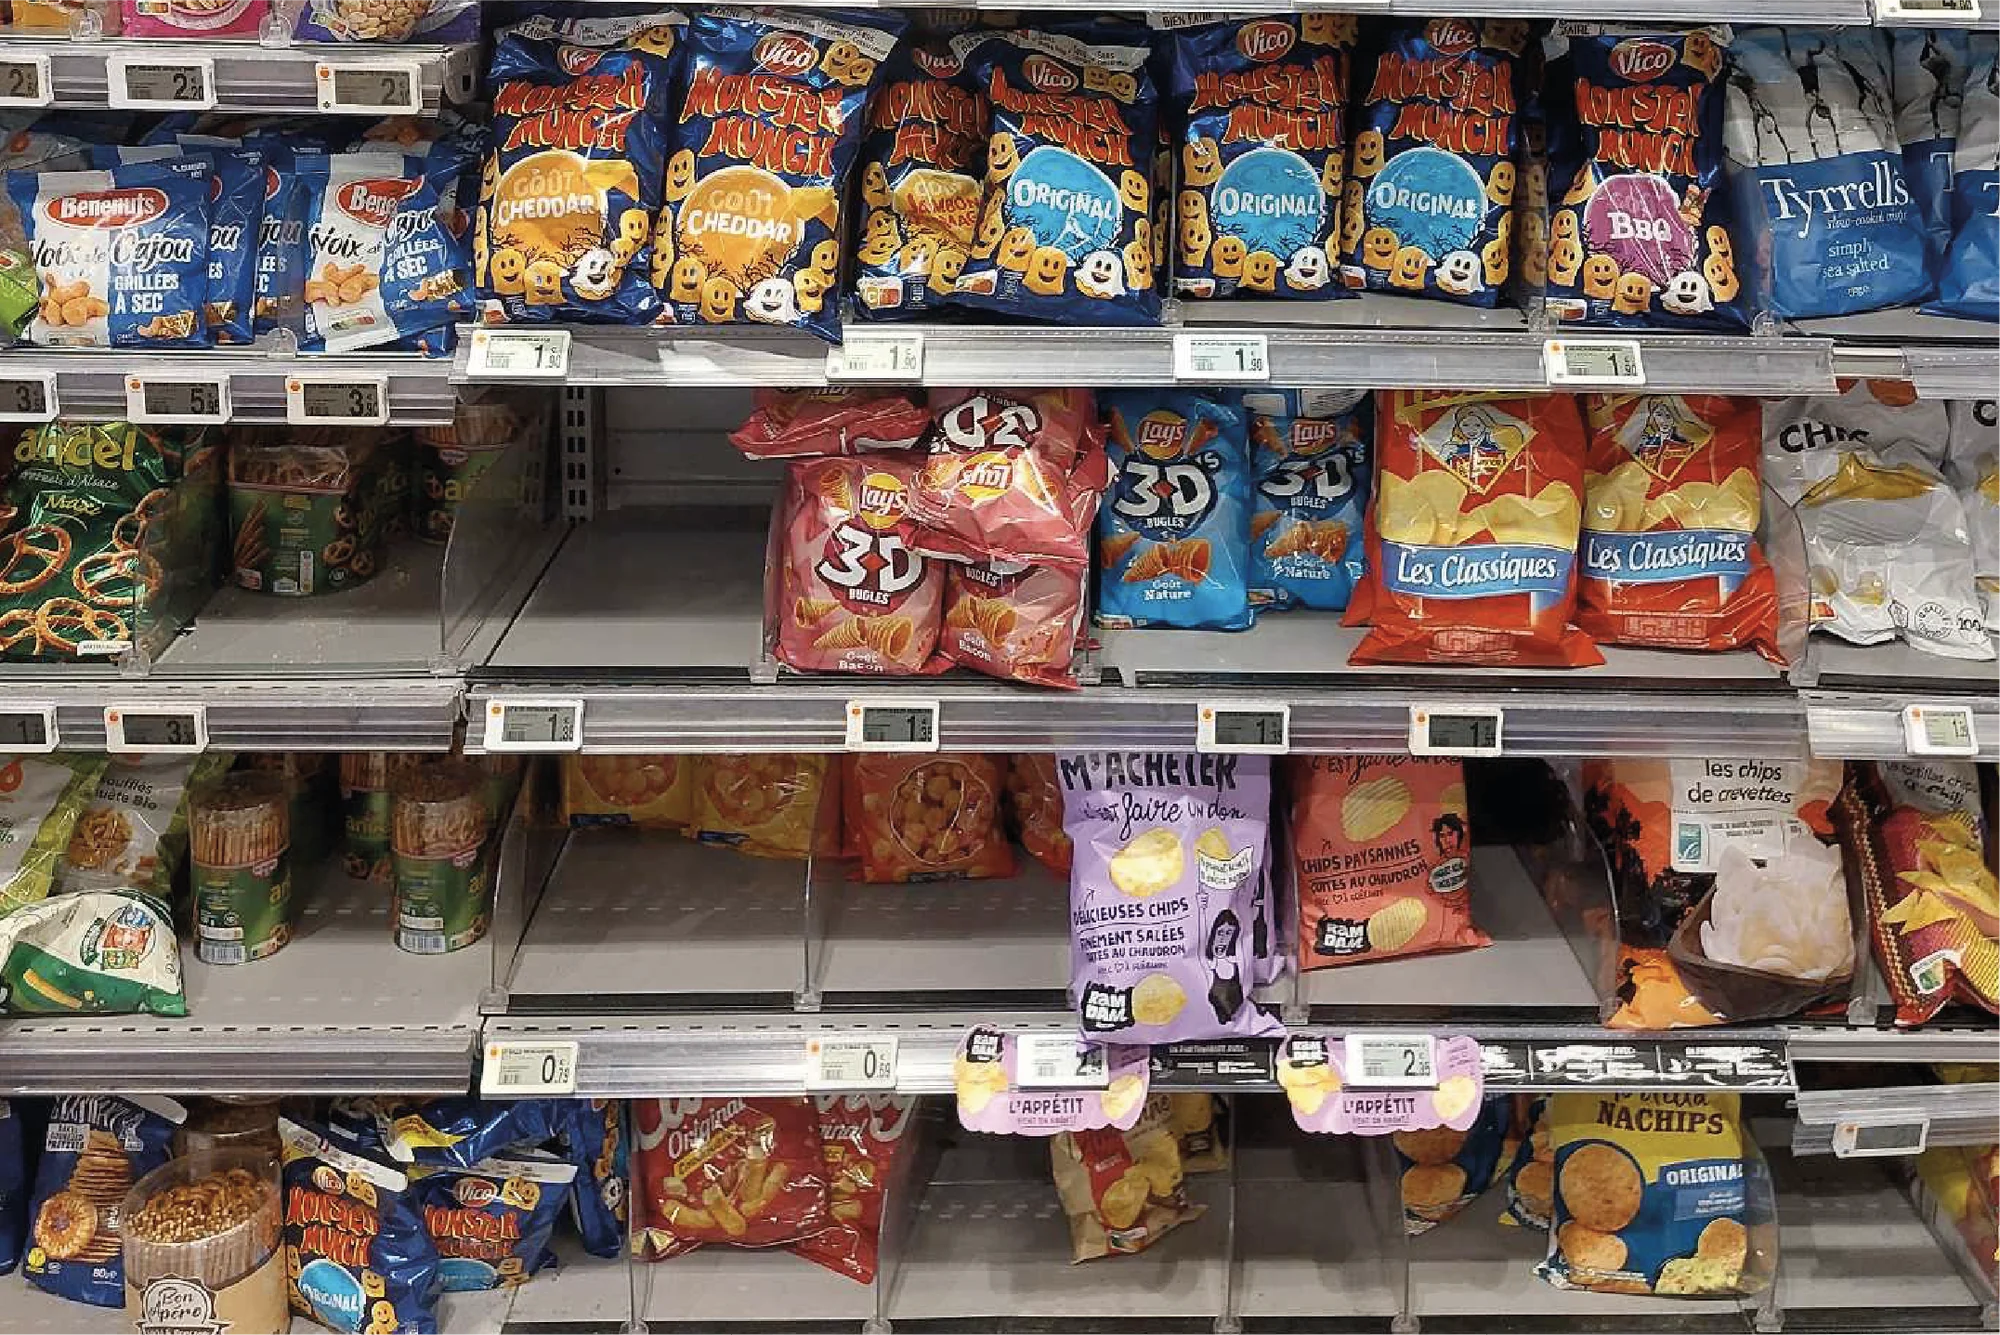
Consumer response also differs by product category. Toilet paper sees high levels of substitution, whereas feminine hygiene products and diapers show very high levels of store-switching and low levels of delayed purchase. The salty-snack category has the highest level of consumers not making the purchase at all.
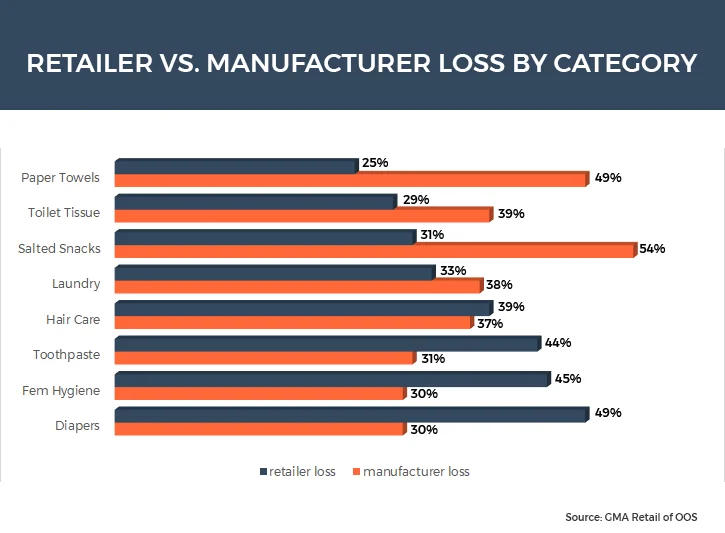
The Most Common Causes of an Out-of-Stock Situation
According to several studies, about one third of OOS situations can be attributed to replenishment problems — that is, having the product in-store but not getting it onto the shelves. A further fifth of OOS occurrences are due to planning decisions, including inadequate shelf-space allocation and low planogram compliance. Together, those two causes account for roughly half of all OOS occurrences.
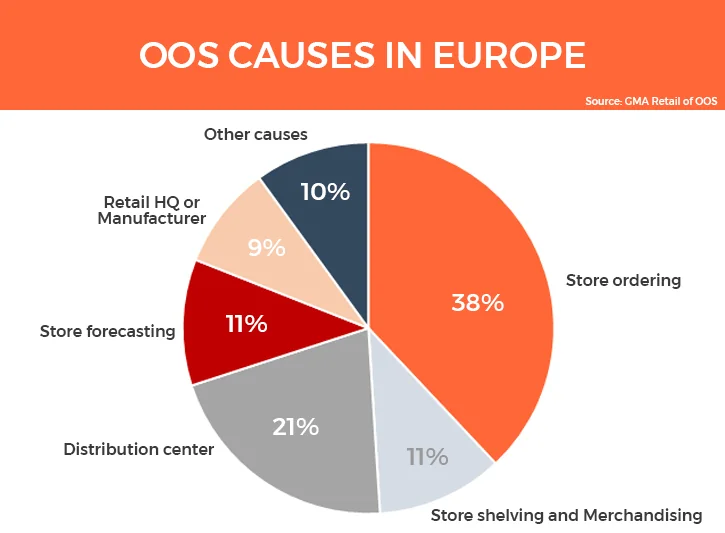
Globally, Europe has the highest share of replenishment problems, which stem from store practices: infrequent, late or missed shelf filling, poor planogram execution, insufficient staff, or congested back rooms where stock is either not found or damaged before it reaches the shelf.
What Roamler's Store Checks Show
Roamler measures out-of-stocks for FMCG brands in thousands of stores every year. A few patterns come back in almost every study:
- No product is safe. In a 2022 Roamler study of four leading products in the tea drinks category, in nearly 200 French hypermarkets and supermarkets, the average OOS rate was 8%. The most affected product was missing in 13% of stores. Market leaders, growing brands and private labels were all affected.
- Results vary a lot by retailer. In the same study, the OOS rate reached 11% in the weakest retail chain. Comparing retailers shows brands where to focus their efforts first.
- Promotions double the risk. Out-of-stock rates on promoted products are generally about twice as high as on regular items.
Source: Roamler internal tea drinks category check, France, 2022 (unpublished).
How Roamler Helps
Roamler helps FMCG and CPG brands across Europe and the US find and fix out-of-stocks:
- Store checks within 48 hours: photo-verified availability data by store, retailer, region and SKU
- Checks adapted to what you need to know: depending on your brief, a check can also look at backroom stock, price tags or delisting, to find out why the product is missing
- Sales data and store checks combined: stores flagged by sales data are checked in person to confirm the problem
- Fixes in store: where needed, a merchandiser can refill the shelf or set the price tag
- A follow-up check to confirm the product is back on the shelf
Want to measure the availability of your products?
We check your priority products across your store network, with photo-verified results within 48 hours.
Get in touchSome frequently asked questions
What percentage of products are out of stock on average in grocery retail?
Industry studies consistently put average grocery OOS rates at 5–10% for mainstream FMCG products, spiking significantly during promotions and new launches. For high-velocity SKUs, even a 2–3% OOS rate represents a substantial, quantifiable revenue loss — the more useful benchmark isn't the industry average but a brand's own rate by retailer, format, and SKU.
What is the difference between an out-of-stock and a stockout?
The terms are effectively synonymous in retail usage — both describe a product expected on the shelf that's physically absent. "Out-of-stock" is the term more commonly used in FMCG brand and retailer contexts specifically for shelf-level absence, while "stockout" is sometimes used more broadly for absence anywhere in the supply chain, including at distribution-centre level.
How long does a typical out-of-stock situation last?
Duration varies by root cause and detection method. Replenishment OOS is typically resolved within hours to a day once identified. Phantom inventory can persist for days or weeks without physical detection, since the system never flags it. Distribution-level OOS can last until the next order cycle, which in some store formats means a full week. This is exactly why early, EPOS-based detection matters — the longer any of these goes unnoticed, the greater the cumulative loss.
How do I check whether my products are on the shelf?
The only reliable way is a store check: someone visits the store, takes a photo of the shelf and confirms whether the product is there. Sales data can show where a product has stopped selling, but not what is happening on the shelf. With on-demand store checks, brands can check hundreds of stores in a few days.
How can I reduce out-of-stocks in supermarkets?
Start by measuring: check your priority products in a representative sample of stores, and sort the out-of-stocks by cause. Then act on the biggest causes first. Replenishment problems are fixed with the store or the retailer, delivery problems with the supply team, and delistings with the sales team. Check again after each action, and plan extra checks during promotions, when the risk is highest.
What is on-shelf availability (OSA)?
On-shelf availability is the share of stores where a product is on the shelf when a shopper wants to buy it. It is the opposite of the out-of-stock rate: an OOS rate of 5% means an OSA of 95%.
What is a good on-shelf availability rate?
Most FMCG brands and retailers aim for an OSA of 95% or more for their main products. The right target depends on the category and the retailer. The most useful benchmark is your own rate over time, by retailer and by product.